January 16, 2018 A Clear Roadmap for Value Creation
UNITED STATES
SECURITIES AND EXCHANGE COMMISSION
Washington, D.C. 20549
SCHEDULE 14A
(Rule 14a-101)
INFORMATION REQUIRED IN PROXY STATEMENT
Proxy Statement Pursuant to Section 14(a) of
the Securities Exchange Act of 1934 (Amendment No. )
|
Filed by the Registrant x | |||
|
| |||
|
Filed by a Party other than the Registrant o | |||
|
| |||
|
Check the appropriate box: | |||
|
o |
Preliminary Proxy Statement | ||
|
o |
Confidential, for Use of the Commission Only (as permitted by Rule 14a-6(e)(2)) | ||
|
o |
Definitive Proxy Statement | ||
|
x |
Definitive Additional Materials | ||
|
o |
Soliciting Material under §240.14a-12 | ||
|
| |||
|
QUALCOMM INCORPORATED | |||
|
(Name of Registrant as Specified In Its Charter) | |||
|
| |||
|
| |||
|
(Name of Person(s) Filing Proxy Statement, if other than the Registrant) | |||
|
| |||
|
Payment of Filing Fee (Check the appropriate box): | |||
|
x |
No fee required. | ||
|
o |
Fee computed on table below per Exchange Act Rules 14a-6(i)(1) and 0-11. | ||
|
|
(1) |
Title of each class of securities to which transaction applies: | |
|
|
|
| |
|
|
(2) |
Aggregate number of securities to which transaction applies: | |
|
|
|
| |
|
|
(3) |
Per unit price or other underlying value of transaction computed pursuant to Exchange Act Rule 0-11 (set forth the amount on which the filing fee is calculated and state how it was determined): | |
|
|
|
| |
|
|
(4) |
Proposed maximum aggregate value of transaction: | |
|
|
|
| |
|
|
(5) |
Total fee paid: | |
|
|
|
| |
|
o |
Fee paid previously with preliminary materials. | ||
|
o |
Check box if any part of the fee is offset as provided by Exchange Act Rule 0-11(a)(2) and identify the filing for which the offsetting fee was paid previously. Identify the previous filing by registration statement number, or the Form or Schedule and the date of its filing. | ||
|
|
(1) |
Amount Previously Paid: | |
|
|
|
| |
|
|
(2) |
Form, Schedule or Registration Statement No.: | |
|
|
|
| |
|
|
(3) |
Filing Party: | |
|
|
|
| |
|
|
(4) |
Date Filed: | |
|
|
|
| |
|
|
|
| |
The following investor presentation may be provided to stockholders of Qualcomm Incorporated (“Qualcomm”).
January 16, 2018 A Clear Roadmap for Value Creation
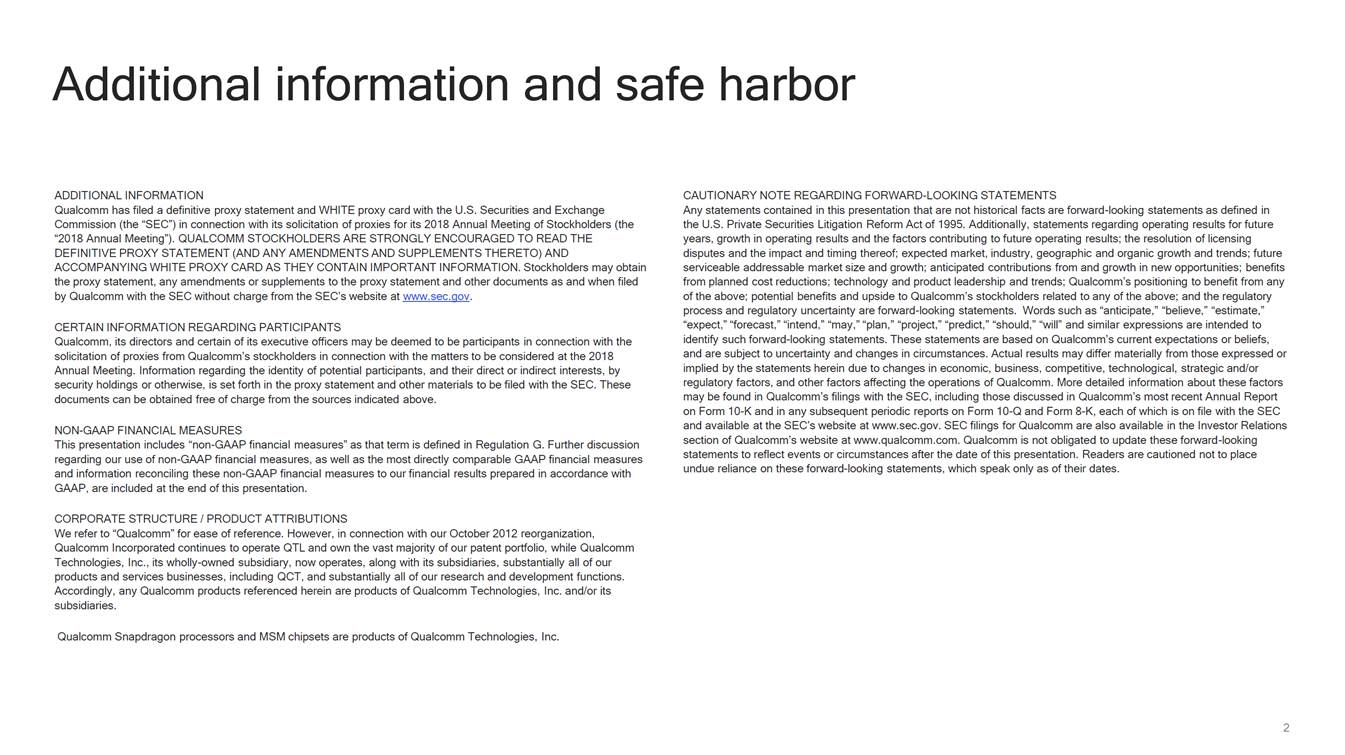
Additional information and safe harbor ADDITIONAL INFORMATION Qualcomm has filed a definitive proxy statement and WHITE proxy card with the U.S. Securities and Exchange Commission (the “SEC”) in connection with its solicitation of proxies for its 2018 Annual Meeting of Stockholders (the “2018 Annual Meeting”). QUALCOMM STOCKHOLDERS ARE STRONGLY ENCOURAGED TO READ THE DEFINITIVE PROXY STATEMENT (AND ANY AMENDMENTS AND SUPPLEMENTS THERETO) AND ACCOMPANYING WHITE PROXY CARD AS THEY CONTAIN IMPORTANT INFORMATION. Stockholders may obtain the proxy statement, any amendments or supplements to the proxy statement and other documents as and when filed by Qualcomm with the SEC without charge from the SEC’s website at www.sec.gov. CAUTIONARY NOTE REGARDING FORWARD-LOOKING STATEMENTS Any statements contained in this presentation that are not historical facts are forward-looking statements as defined in the U.S. Private Securities Litigation Reform Act of 1995. Additionally, statements regarding operating results for future years, growth in operating results and the factors contributing to future operating results; the resolution of licensing disputes and the impact and timing thereof; expected market, industry, geographic and organic growth and trends; future serviceable addressable market size and growth; anticipated contributions from and growth in new opportunities; benefits from planned cost reductions; technology and product leadership and trends; Qualcomm’s positioning to benefit from any of the above; potential benefits and upside to Qualcomm’s stockholders related to any of the above; and the regulatory process and regulatory uncertainty are forward-looking statements. Words such as “anticipate,” “believe,” “estimate,” “expect,” “forecast,” “intend,” “may,” “plan,” “project,” “predict,” “should,” “will” and similar expressions are intended to identify such forward-looking statements. These statements are based on Qualcomm’s current expectations or beliefs, and are subject to uncertainty and changes in circumstances. Actual results may differ materially from those expressed or implied by the statements herein due to changes in economic, business, competitive, technological, strategic and/or regulatory factors, and other factors affecting the operations of Qualcomm. More detailed information about these factors may be found in Qualcomm’s filings with the SEC, including those discussed in Qualcomm’s most recent Annual Report on Form 10-K and in any subsequent periodic reports on Form 10-Q and Form 8-K, each of which is on file with the SEC and available at the SEC’s website at www.sec.gov. SEC filings for Qualcomm are also available in the Investor Relations section of Qualcomm’s website at www.qualcomm.com. Qualcomm is not obligated to update these forward-looking statements to reflect events or circumstances after the date of this presentation. Readers are cautioned not to place undue reliance on these forward-looking statements, which speak only as of their dates. CERTAIN INFORMATION REGARDING PARTICIPANTS Qualcomm, its directors and certain of its executive officers may be deemed to be participants in connection with the solicitation of proxies from Qualcomm’s stockholders in connection with the matters to be considered at the 2018 Annual Meeting. Information regarding the identity of potential participants, and their direct or indirect interests, by security holdings or otherwise, is set forth in the proxy statement and other materials to be filed with the SEC. These documents can be obtained free of charge from the sources indicated above. NON-GAAP FINANCIAL MEASURES This presentation includes “non-GAAP financial measures” as that term is defined in Regulation G. Further discussion regarding our use of non-GAAP financial measures, as well as the most directly comparable GAAP financial measures and information reconciling these non-GAAP financial measures to our financial results prepared in accordance with GAAP, are included at the end of this presentation. CORPORATE STRUCTURE / PRODUCT ATTRIBUTIONS We refer to “Qualcomm” for ease of reference. However, in connection with our October 2012 reorganization, Qualcomm Incorporated continues to operate QTL and own the vast majority of our patent portfolio, while Qualcomm Technologies, Inc., its wholly-owned subsidiary, now operates, along with its subsidiaries, substantially all of our products and services businesses, including QCT, and substantially all of our research and development functions. Accordingly, any Qualcomm products referenced herein are products of Qualcomm Technologies, Inc. and/or its subsidiaries. Qualcomm Snapdragon processors and MSM chipsets are products of Qualcomm Technologies, Inc. 2
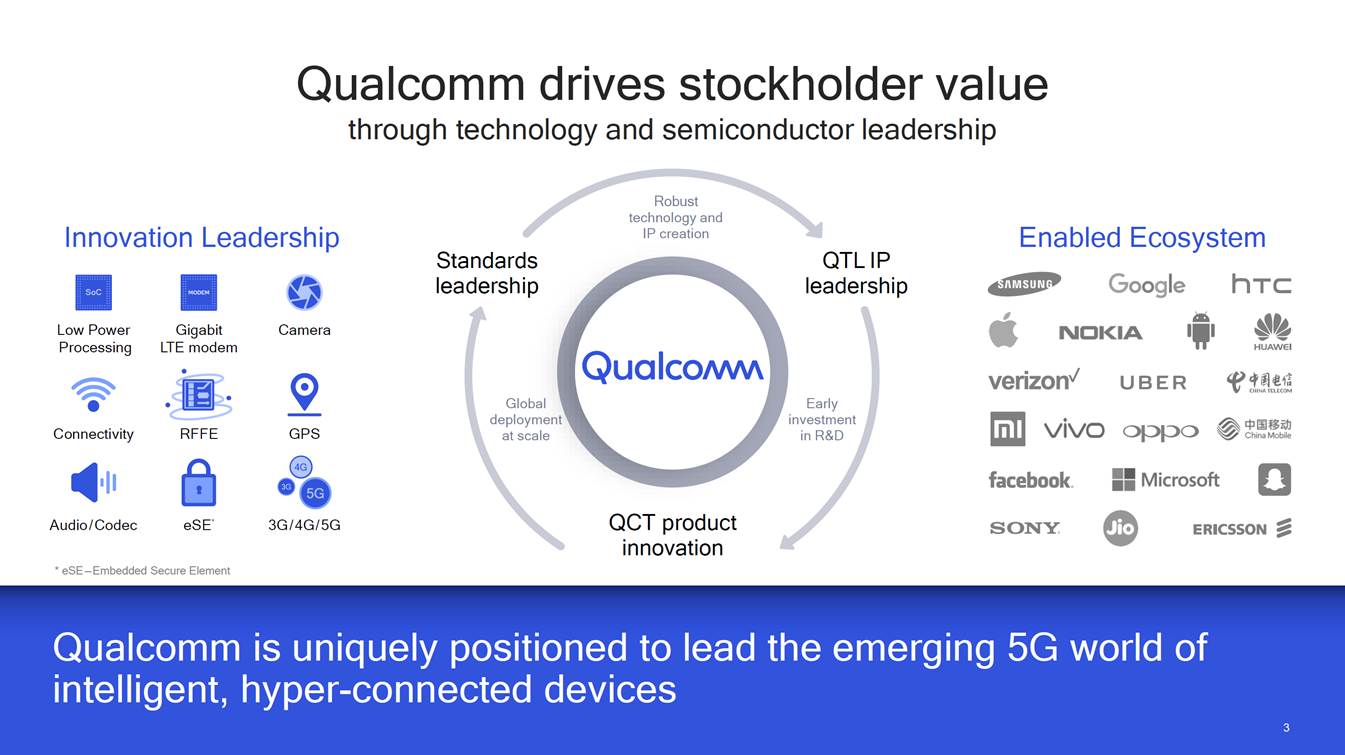
Qualcomm drives stockholder value through technology and semiconductor leadership Robust technology and IP creation Innovation Leadership Enabled Ecosystem Standards leadership QTL IP leadership SoC Low Power Processing Gigabit LTE modem Camera Global deployment at scale Early investment in R&D Connectivity RFFE GPS QCT product innovation Audio/ Codec eSE* 3G/ 4G/ 5G * eSE — Embedded Secure Element intelligent, hyper-connected devices 3
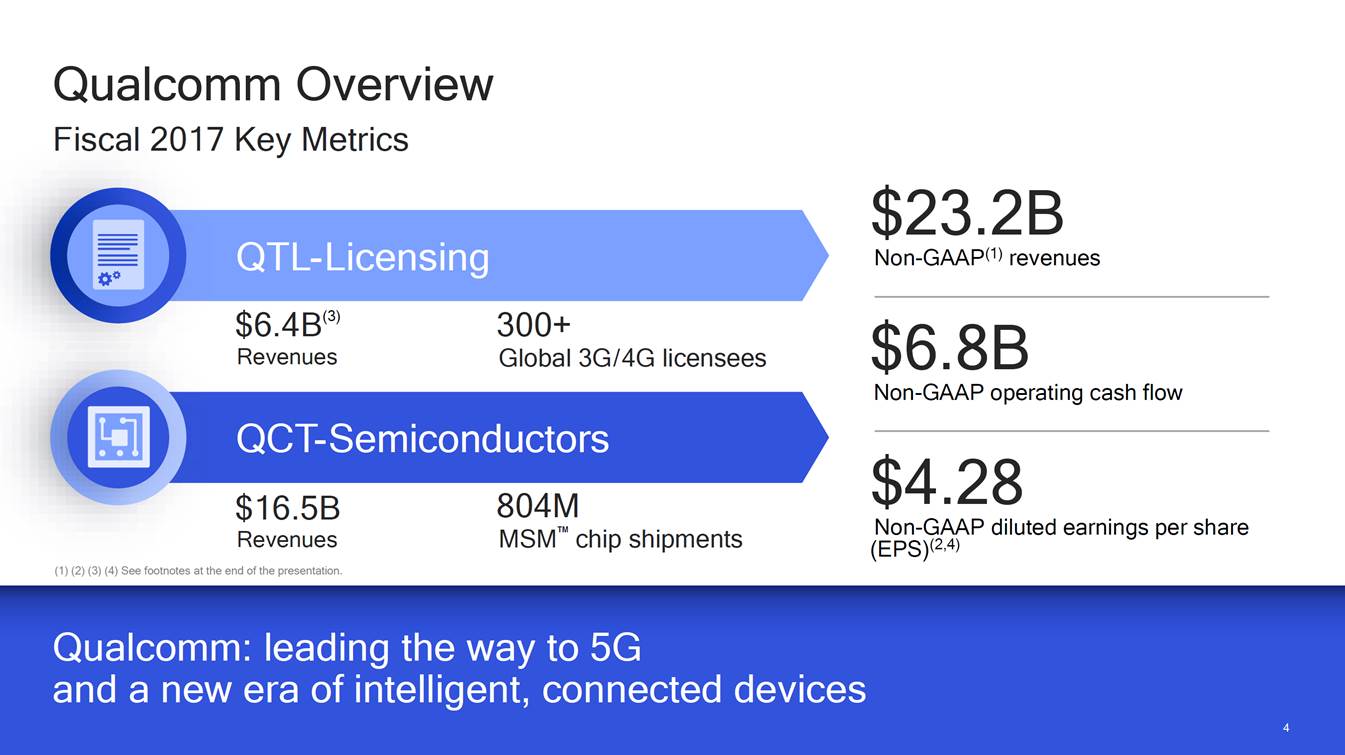
Qualcomm Overview Fiscal 2017 Key Metrics $23.2B Non-GAAP(1) revenues QTL-Licensing $6.4B(3) Revenues 300+ Global 3G/4G licensees $6.8B Non-GAAP operating cash flow QCT-Semiconductors $4.28 Non-GAAP diluted earnings per share (EPS)(2,4) 804M MSM™ chip shipments $16.5B Revenues (1) (2) (3) (4) See footnotes at the end of the presentation. and a new era of intelligent, connected devices 4
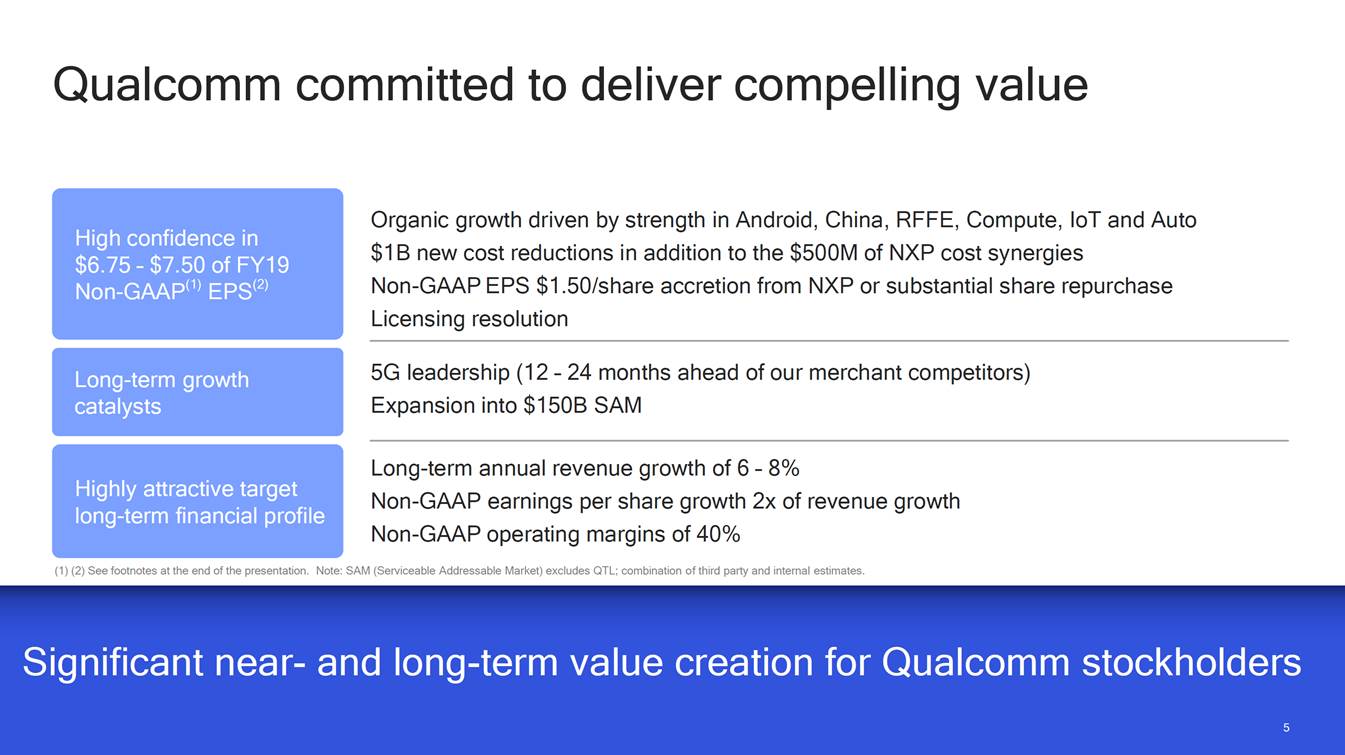
Qualcomm committed to deliver compelling value Organic growth driven by strength in Android, China, RFFE, Compute, IoT and Auto $1B new cost reductions in addition to the $500M of NXP cost synergies Non-GAAP EPS $1.50/share accretion from NXP or substantial share repurchase Licensing resolution High confidence in $6.75 – $7.50 of FY19 Non-GAAP(1) EPS(2) 5G leadership (12 – 24 months ahead of our merchant competitors) Expansion into $150B SAM Long-term growth catalysts Long-term annual revenue growth of 6 – 8% Non-GAAP earnings per share growth 2x of revenue growth Non-GAAP operating margins of 40% Highly attractive target long-term financial profile (1) (2) See footnotes at the end of the presentation. Note: SAM (Serviceable Addressable Market) excludes QTL; combination of third party and internal estimates. Significant near-and long-term value creation for Qualcomm stockholders 5
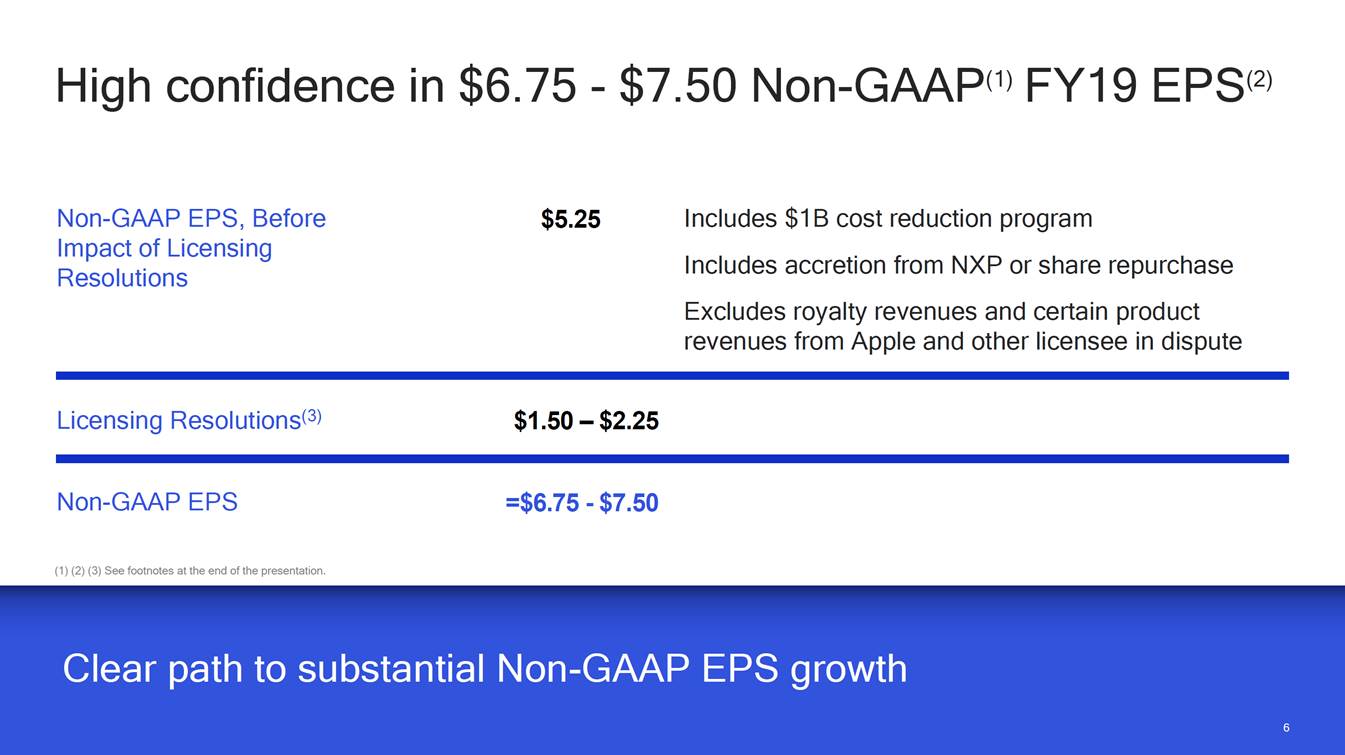
High confidence in $6.75 - $7.50 Non-GAAP(1) FY19 EPS(2) Non-GAAP EPS, Before Impact of Licensing Resolutions Includes $1B cost reduction program Includes accretion from NXP or share repurchase Excludes royalty revenues and certain product revenues from Apple and other licensee in dispute $5.25 Licensing Resolutions(3) $1.50 – $2.25 Non-GAAP EPS =$6.75 - $7.50 (1) (2) (3) See footnotes at the end of the presentation. Clear path to substantial Non-GAAP EPS growth 6
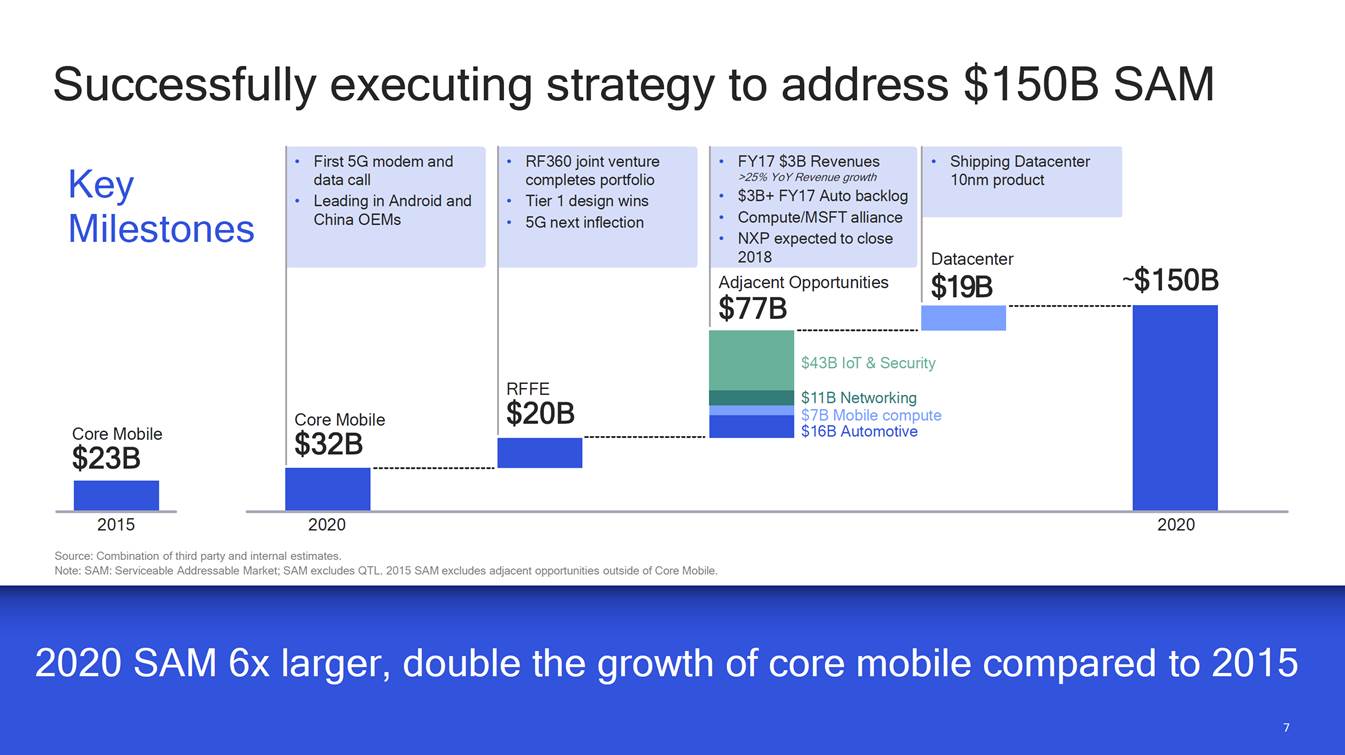
Successfully executing strategy to address $150B SAM Key Milestones ~$150B $19B $7B Mobile compute Core Mobile $23B 2015 2020 2020 Source: Combination of third party and internal estimates. Note: SAM: Serviceable Addressable Market; SAM excludes QTL. 2015 SAM excludes adjacent opportunities outside of Core Mobile. 2020 SAM 6x larger, double the growth of core mobile compared to 2015 7 • First 5G modem and data call • Leading in Android and China OEMs Core Mobile $32B • RF360 joint venture completes portfolio • Tier 1 design wins • 5G next inflection RFFE $20B • FY17 $3B Revenues >25% YoY Revenue growth • $3B+ FY17 Auto backlog • Compute/MSFT alliance • NXP expected to close 2018 Adjacent Opportunities $77B • Shipping Datacenter 10nm product Datacenter $43B IoT & Security $11B Networking $16B Automotive
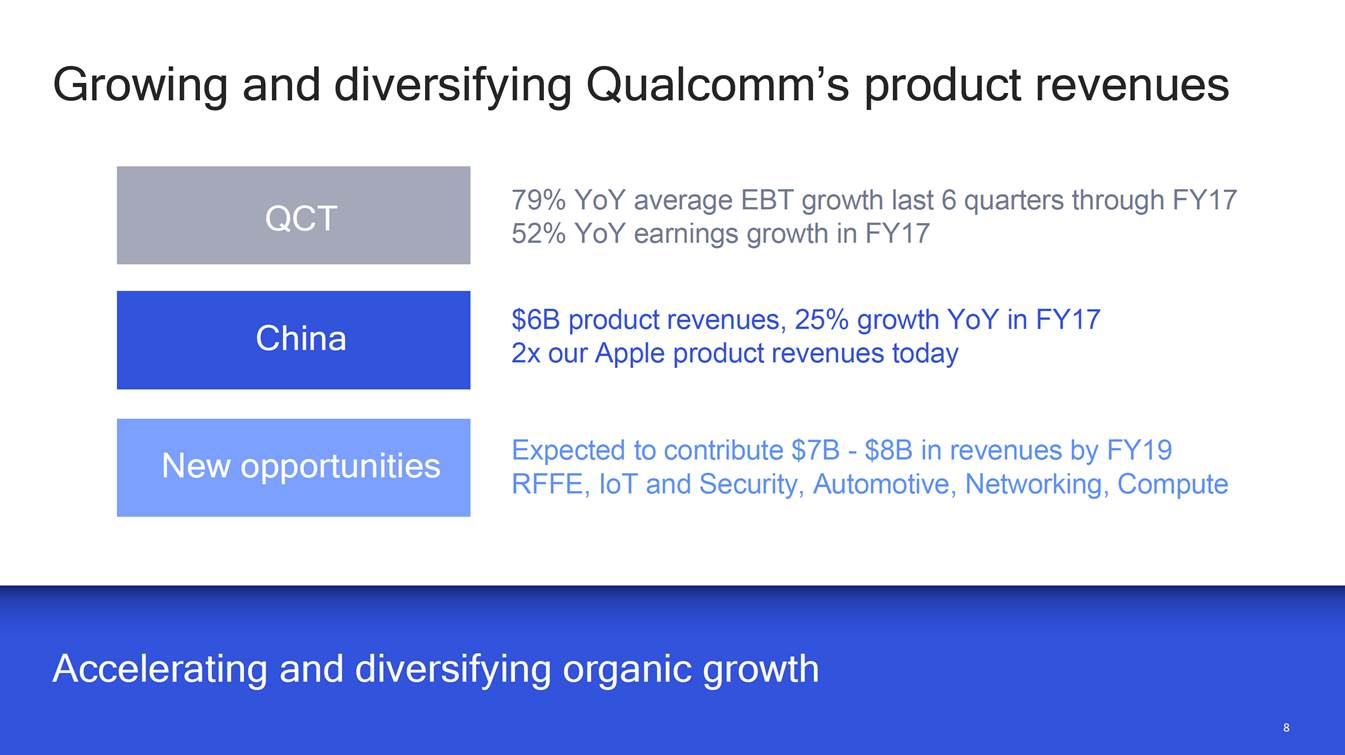
Growing and diversifying Qualcomm’s product revenues 79% YoY average EBT growth last 6 quarters through FY17 52% YoY earnings growth in FY17 $6B product revenues, 25% growth YoY in FY17 2x our Apple product revenues today Expected to contribute $7B - $8B in revenues by FY19 RFFE, IoT and Security, Automotive, Networking, Compute Accelerating and diversifying organic growth 8 New opportunities China QCT
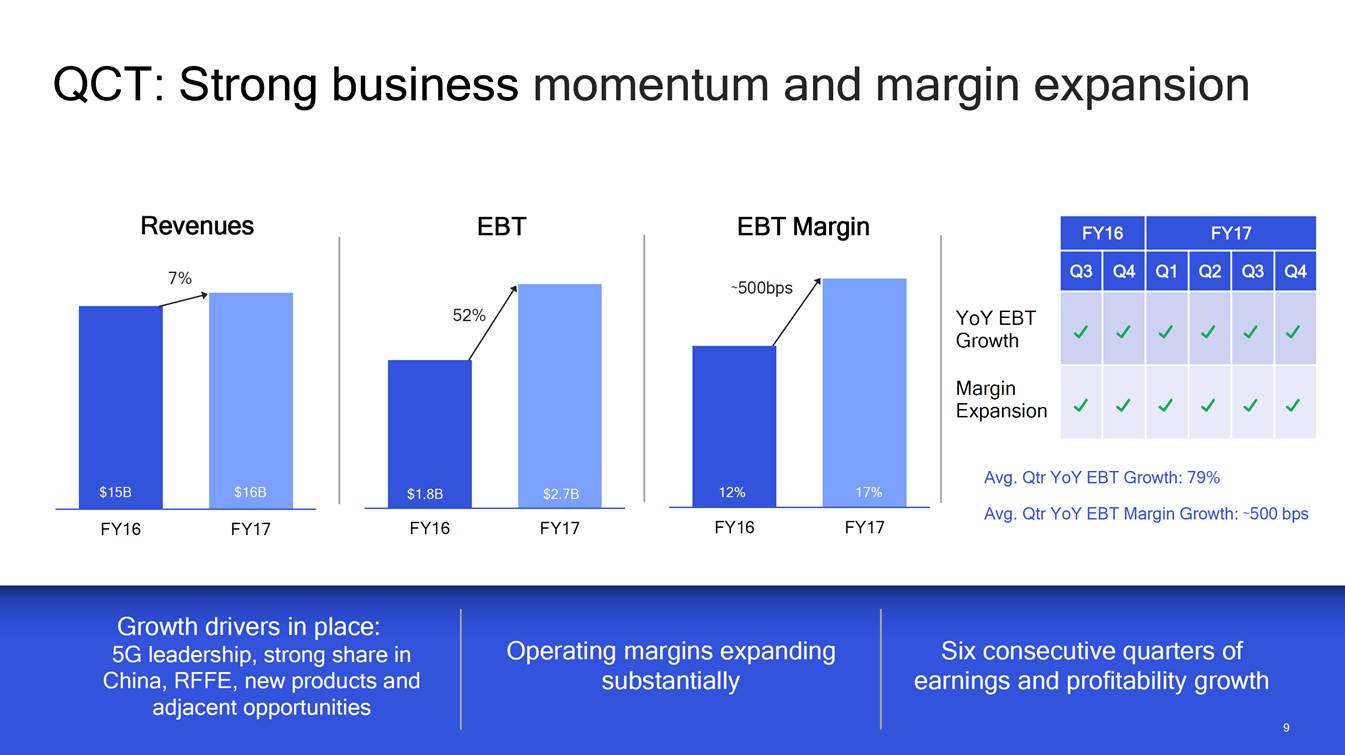
QCT: Strong business momentum and margin expansion Revenues EBT EBT Margin 7% YoY EBT Growth Margin Expansion Avg. Qtr YoY EBT Growth: 79% Avg. Qtr YoY EBT Margin Growth: ~500 bps FY16 FY17 FY16 FY17 FY16 FY17 Growth drivers in place: 5G leadership, strong share in China, RFFE, new products and adjacent opportunities Operating margins expanding substantially Six consecutive quarters of earnings and profitability growth 9 $16B $15B 52% $2.7B $1.8B ~500bps 17% 12% FY16 FY17 Q3 Q4 Q1 Q2 Q3 Q4
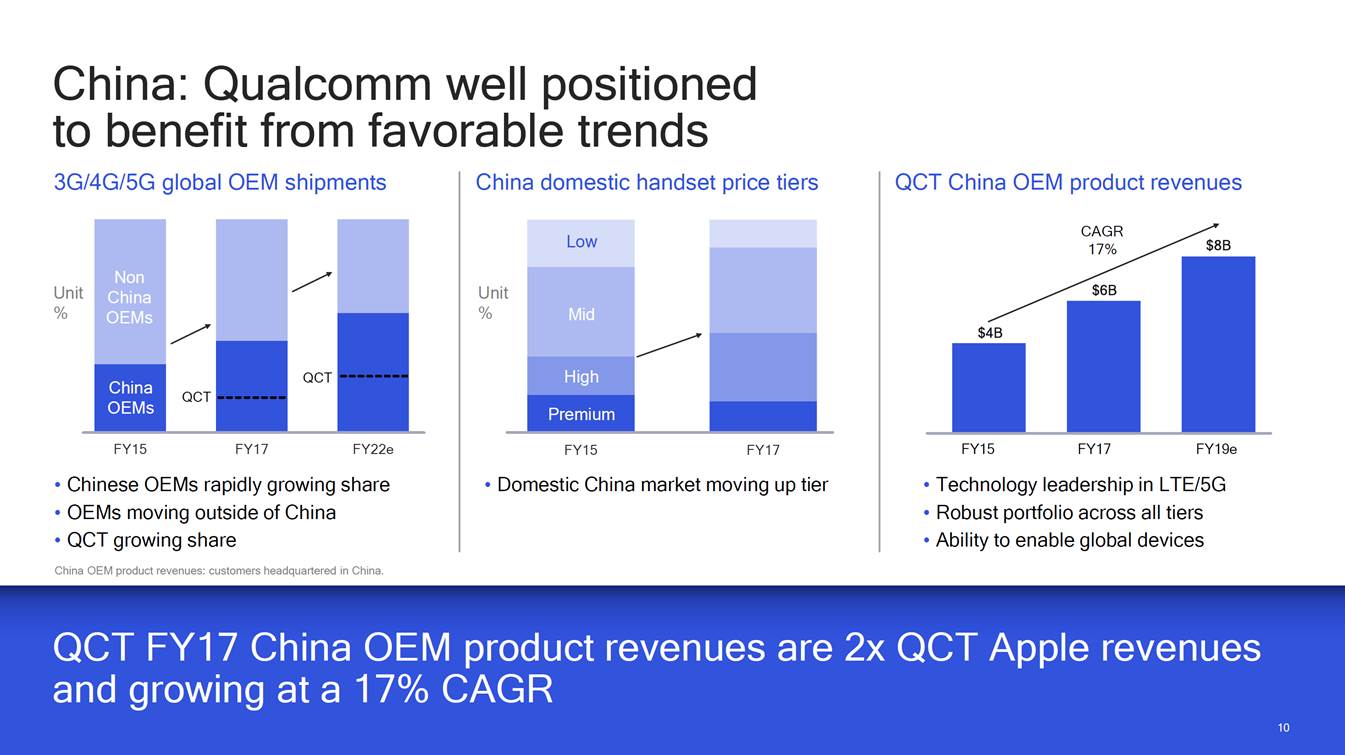
China: Qualcomm well positioned to benefit from favorable trends 3G/4G/5G global OEM shipments China domestic handset price tiers QCT China OEM product revenues CAGR 17% $8B Unit Unit % % OEMs FY15 FY17 FY22e FY15 FY17 FY19e FY15 FY17 • Chinese OEMs rapidly growing share • OEMs moving outside of China • QCT growing share China OEM product revenues: customers headquartered in China. • Domestic China market moving up tier • Technology leadership in LTE/5G • Robust portfolio across all tiers • Ability to enable global devices and growing at a 17% CAGR 10 $6B $4B Non China OEMs QCT QCT China Low Mid High Premium
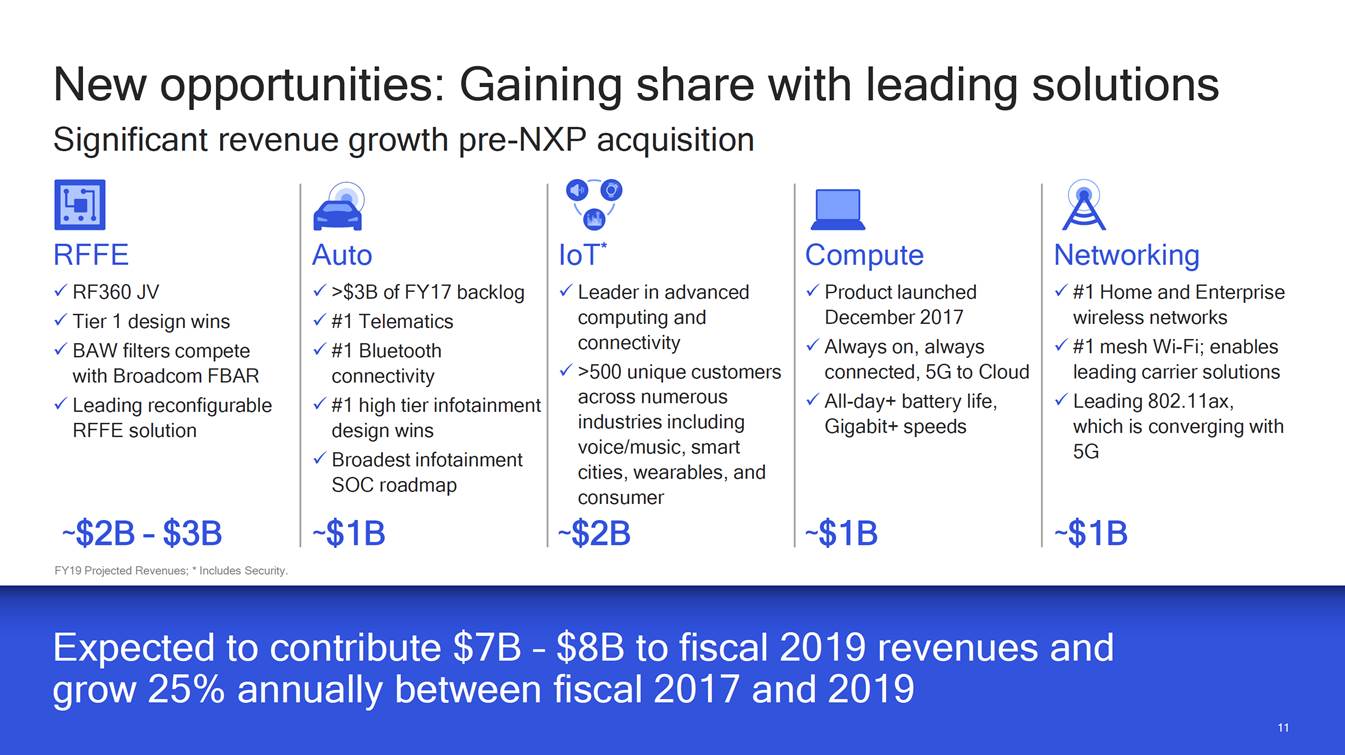
New opportunities: Gaining share pre-NXP acquisition with leading solutions Significant revenue growth RFFE RF360 JV Tier 1 design wins BAW filters compete with Broadcom FBAR Leading reconfigurable RFFE solution Auto >$3B of FY17 backlog #1 Telematics #1 Bluetooth connectivity #1 high tier infotainment design wins Broadest infotainment SOC roadmap IoT* Leader in advanced computing and connectivity >500 unique customers across numerous industries including voice/music, smart cities, wearables, and consumer ~$2B Compute Product launched December 2017 Always on, always connected, 5G to Cloud All-day+ battery life, Gigabit+ speeds Networking #1 Home and Enterprise wireless networks #1 mesh Wi-Fi; enables leading carrier solutions Leading 802.11ax, which is converging with 5G ~$2B – $3B FY19 Projected Revenues; * Includes Security. ~$1B ~$1B ~$1B grow 25% annually between fiscal 2017 and 2019 11
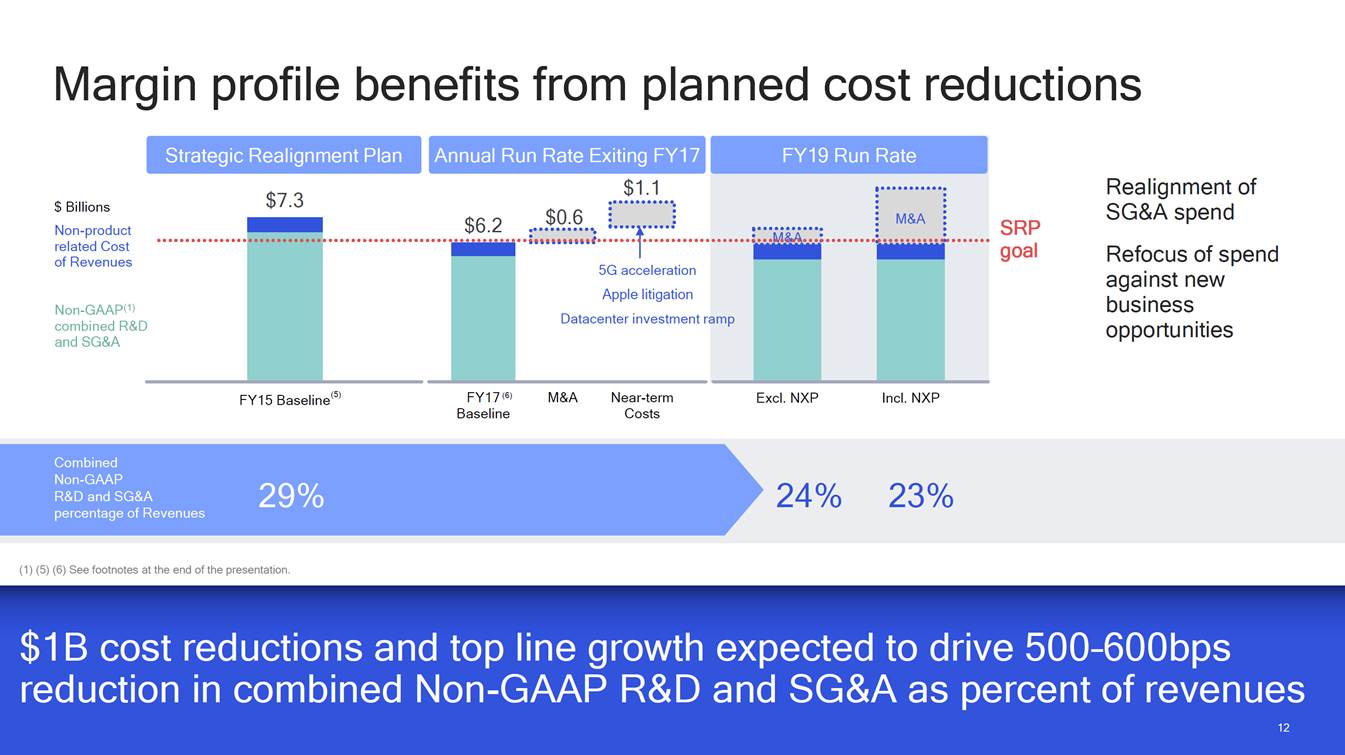
Margin profile benefits from planned cost reductions Realignment of SG&A spend Refocus of spend against new business opportunities $ Billions Non-product related Cost of Revenues $0.6 $6.2 SRP goal Non-GAAP(1) amp combined R&D and SG&A FY15 Baseline(5) FY17 (6) Baseline M&A Near-term Costs Excl. NXP Incl. NXP Combined Non-GAAP R&D and SG&A percentage of Revenues 29% 24% 23% (1) (5) (6) See footnotes at the end of the presentation. reduction in combined Non-GAAP R&D and SG&A as percent of revenues 12 Strategic Realignment PlanAnnual Run Rate Exiting FY17 $1.1 $7.3 FY19 Run Rate M&A M&A 5G acceleration Apple litigation Datacenter investment r
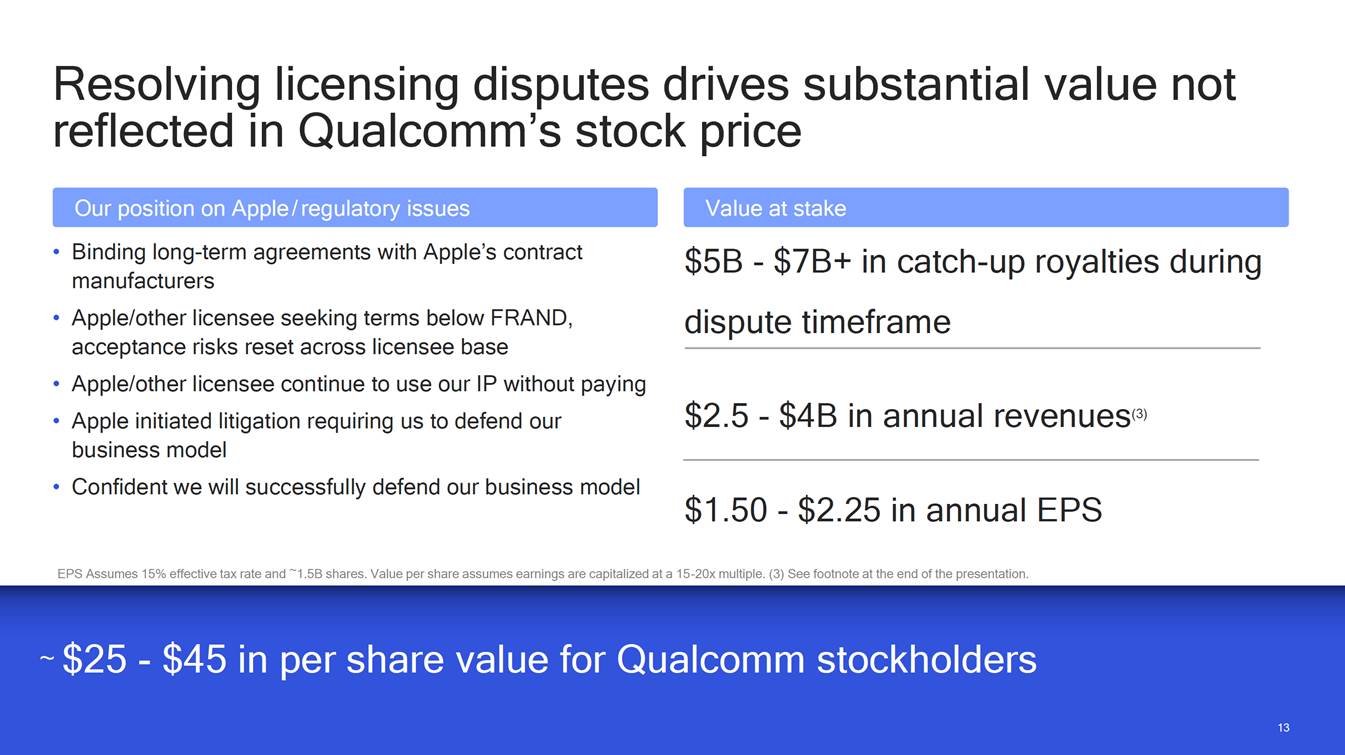
Resolving licensing disputes drives substantial value reflected in Qualcomm’s stock price not Our position on Apple/ regulatory issues Binding long-term agreements with Apple’s contract manufacturers Apple/other licensee seeking terms below FRAND, acceptance risks reset across licensee base Apple/other licensee continue to use our IP without paying Apple initiated litigation requiring us to defend our business model Confident we will successfully defend our business model Value at stake • $5B - $7B+ in catch-up royalties dispute timeframe during • • • $2.5 - $4B in annual revenues(3) • $1.50 - $2.25 in annual EPS EPS Assumes 15% effective tax rate and ~1.5B shares. Value per share assumes earnings are capitalized at a 15 -20x multiple. (3) See footnote at the end of the presentation. ~ $25 - $45 in per share value for Qualcomm stockholders 13
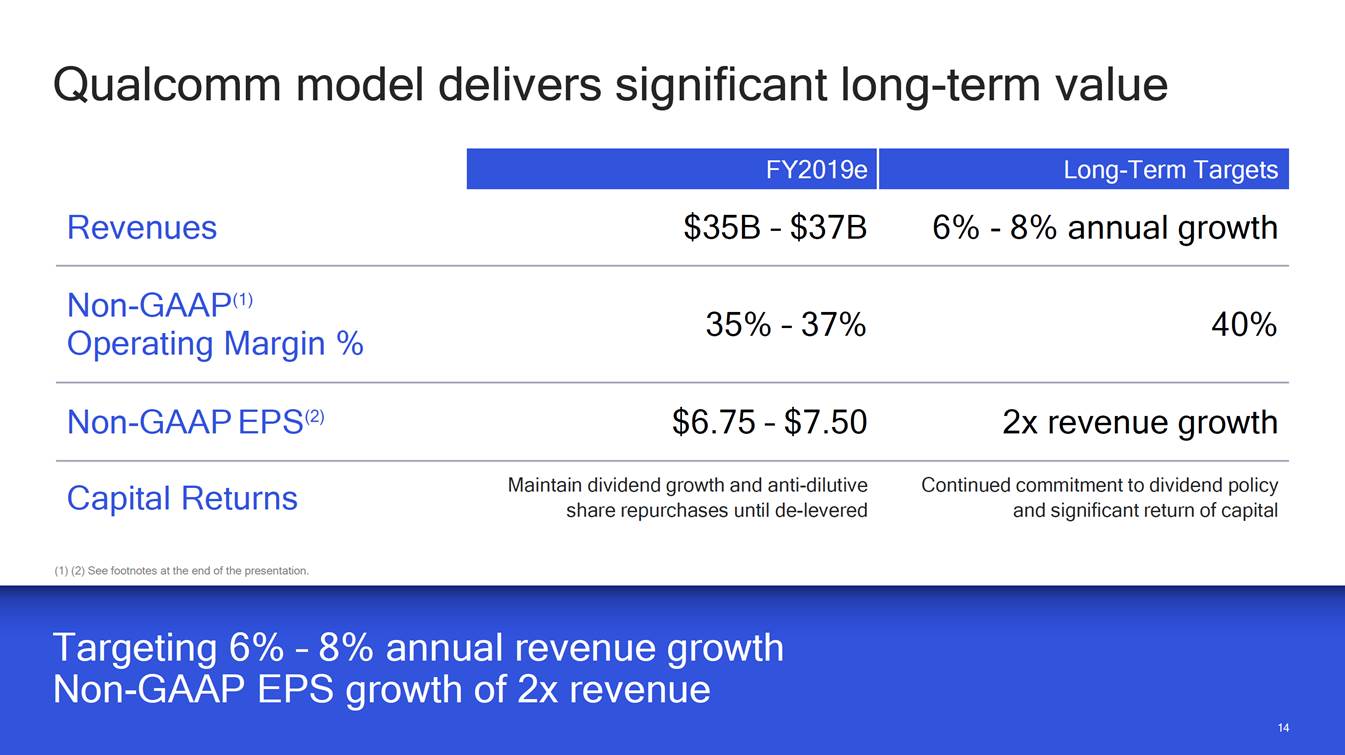
Qualcomm model delivers significant long-term value Revenues $35B – $37B 6% - 8% annual growth Non-GAAP(1) Operating Margin 35% – 37% 40% % Non-GAAP EPS(2) $6.75 – $7.50 2x revenue growth Maintain dividend growth and anti-dilutive share repurchases until de-levered Continued commitment to dividend policy and significant return of capital Capital Returns (1) (2) See footnotes at the end of the presentation. Non-GAAP EPS growth of 2x revenue 14 FY2019e Long-Term Targets
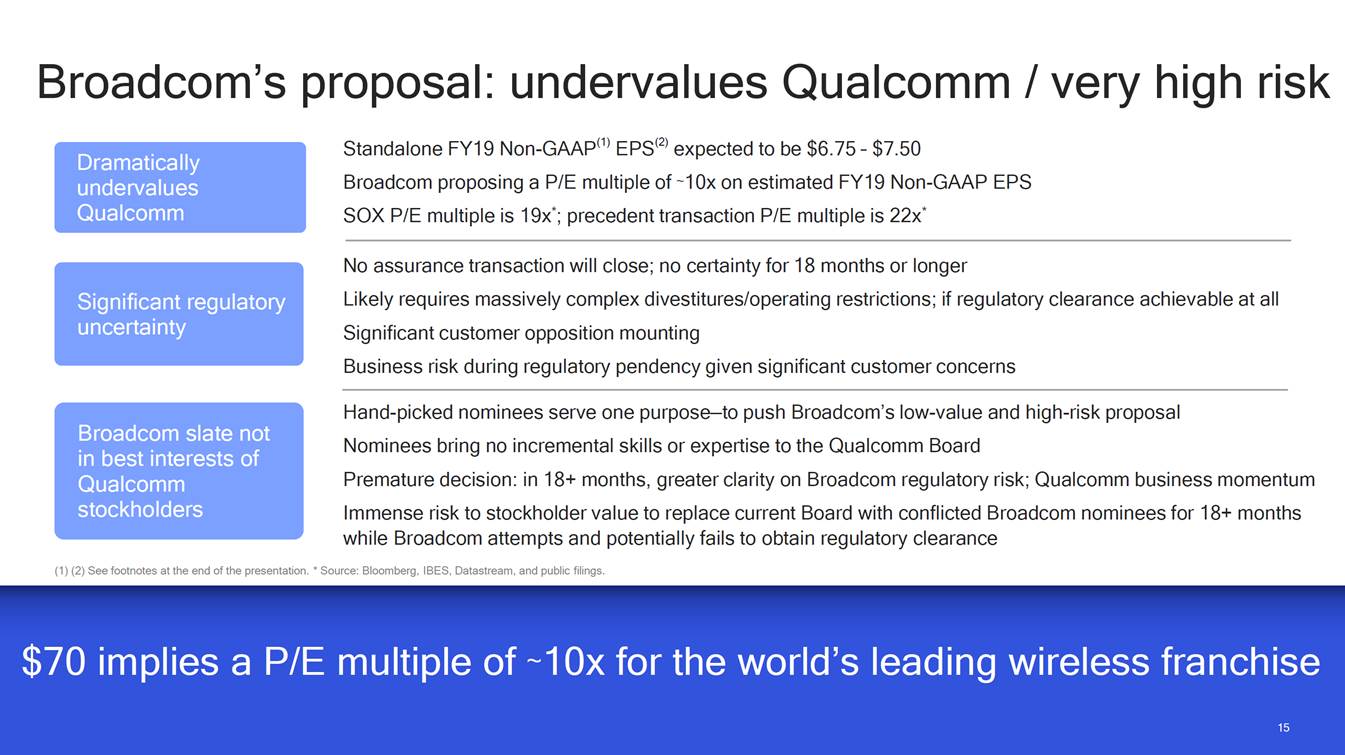
Broadcom’s Dramatically undervalues Qualcomm proposal: undervalues Qualcomm / very high risk Standalone FY19 Non-GAAP(1) EPS(2) expected to be $6.75 – $7.50 Broadcom proposing a P/E multiple of ~10x on estimated FY19 Non-GAAP EPS SOX P/E multiple is 19x*; precedent transaction P/E multiple is 22x* No assurance transaction will close; no certainty for 18 months or longer Likely requires massively complex divestitures/operating restrictions; if regulatory clearance achievable at all Significant customer opposition mounting Business risk during regulatory pendency given significant customer concerns Significant regulatory uncertainty Hand-picked nominees serve one purpose—to push Broadcom’s low-value and high-risk proposal Nominees bring no incremental skills or expertise to the Qualcomm Board Premature decision: in 18+ months, greater clarity on Broadcom regulatory risk; Qualcomm business momentum Immense risk to stockholder value to replace current Board with conflicted Broadcom nominees for 18+ months while Broadcom attempts and potentially fails to obtain regulatory clearance Broadcom slate not in best interests of Qualcomm stockholders (1) (2) See footnotes at the end of the presentation. * Source: Bloomberg, IBES, Datastream, and public filings. $70 implies a P/E multiple of ~10x for the world’s leading wireless franchise 15
Catalysts to Sustained Growth 16
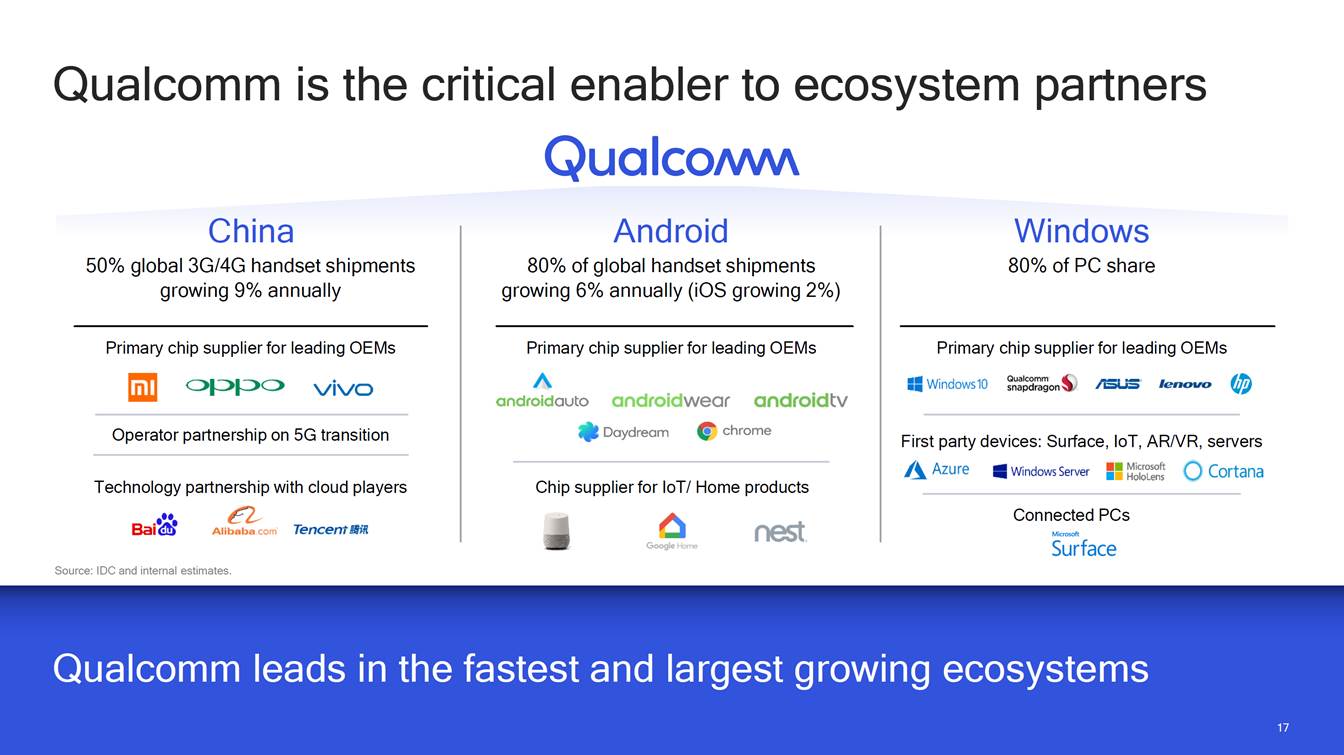
Qualcomm is the critical enabler to ecosystem partners China 50% global 3G/4G handset shipments growing 9% annually Android 80% of global handset shipments growing 6% annually (iOS growing 2%) Windows 80% of PC share Primary chip supplier for leading OEMs Primary chip supplier for leading OEMs Primary chip supplier for leading OEMs Operator partnership on 5G transition First party devices: Surface, IoT, AR/VR, servers Technology partnership with cloud players Chip supplier for IoT/ Home products Connected PCs Source: IDC and internal estimates. Qualcomm leads in the fastest and largest growing ecosystems 17
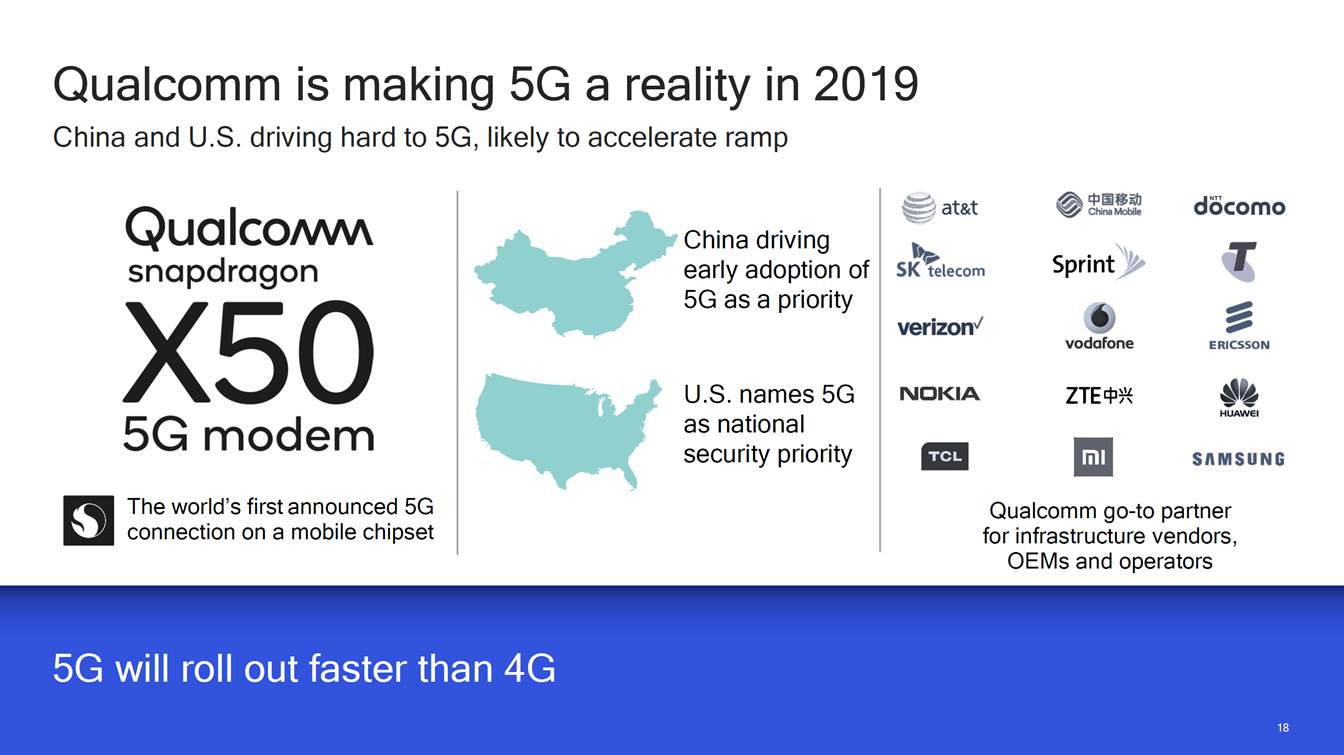
Qualcomm is making 5G a reality in 2019 China and U.S. driving hard to 5G, likely to accelerate ramp China driving early adoption of 5G as a priority U.S. names 5G as national security priority The world’s first announced 5G connection on a mobile chipset Qualcomm go-to partner for infrastructure vendors, OEMs and operators 5G will roll out faster than 4G 18
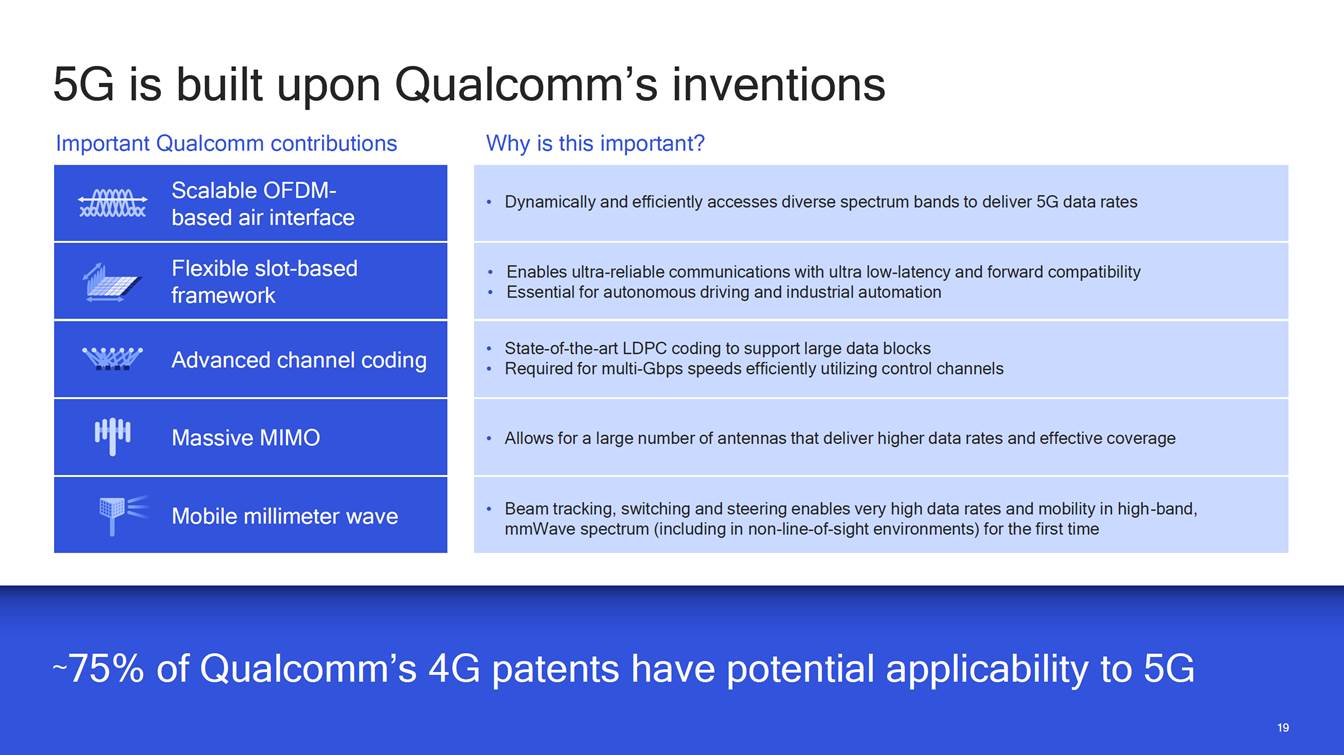
5G is built upon Qualcomm’s inventions Important Qualcomm contributions Why is this important? • Required for multi-Gbps speeds efficiently utilizing control channels mmWave spectrum (including in non-line-of-sight environments) for the first time ~75% of Qualcomm’s 4G patents have potential applicability to 5G 19 • Dynamically and efficiently accesses diverse spectrum bands to deliver 5G data rates • Enables ultra-reliable communications with ultra low-latency and forward compatibility • Essential for autonomous driving and industrial automation • State-of-the-art LDPC coding to support large data blocks • Allows for a large number of antennas that deliver higher data rates and effective coverage • Beam tracking, switching and steering enables very high data rates and mobility in high-band, Scalable OFDM-based air interface Flexible slot-based framework Advanced channel coding Massive MIMO Mobile millimeter wave
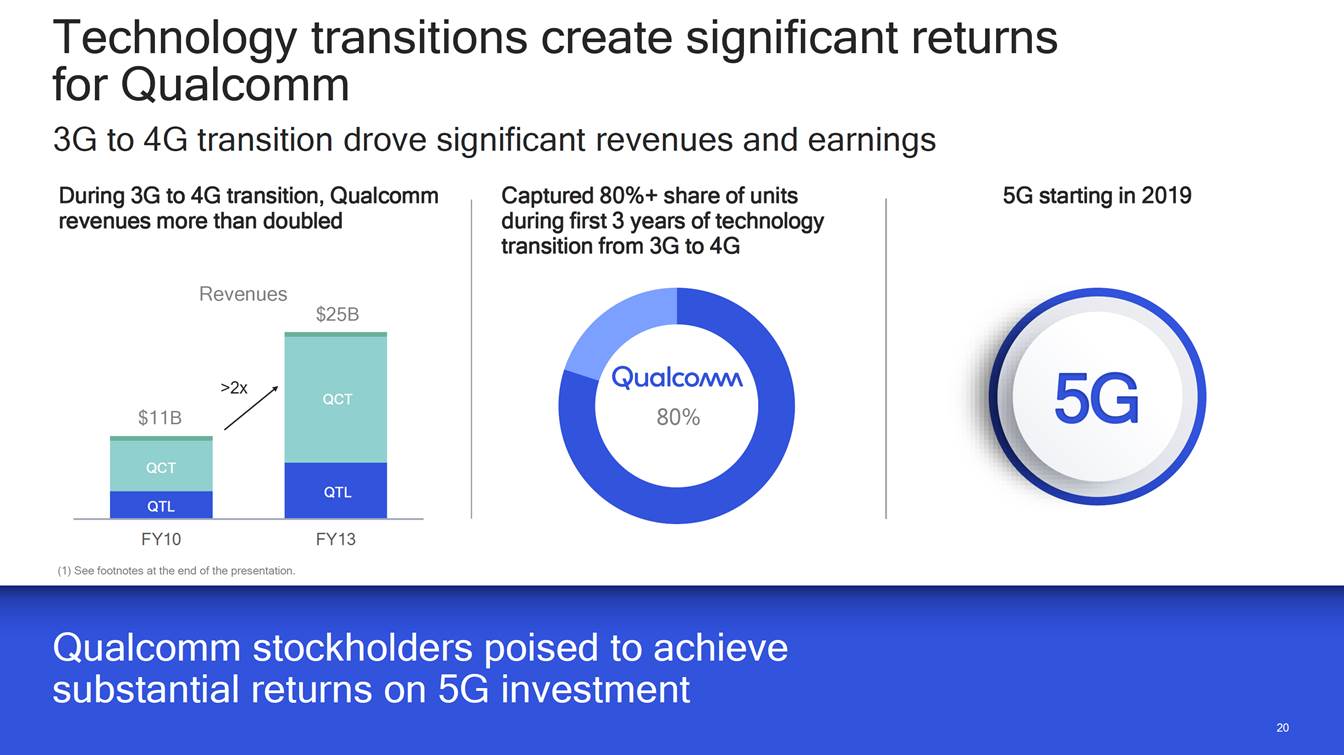
Technology transitions create significant returns for Qualcomm 3G to 4G transition drove significant revenues and earnings During 3G to 4G transition, Qualcomm revenues more than doubled Captured 80%+ share of units during first 3 years of technology transition from 3G to 4G 5G starting in 2019 Revenues $25B 5G 80% FY10 (1) See footnotes at the end of the presentation. FY13 substantial returns on 5G investment 20 >2x $11B QCT QCT QTL QTL
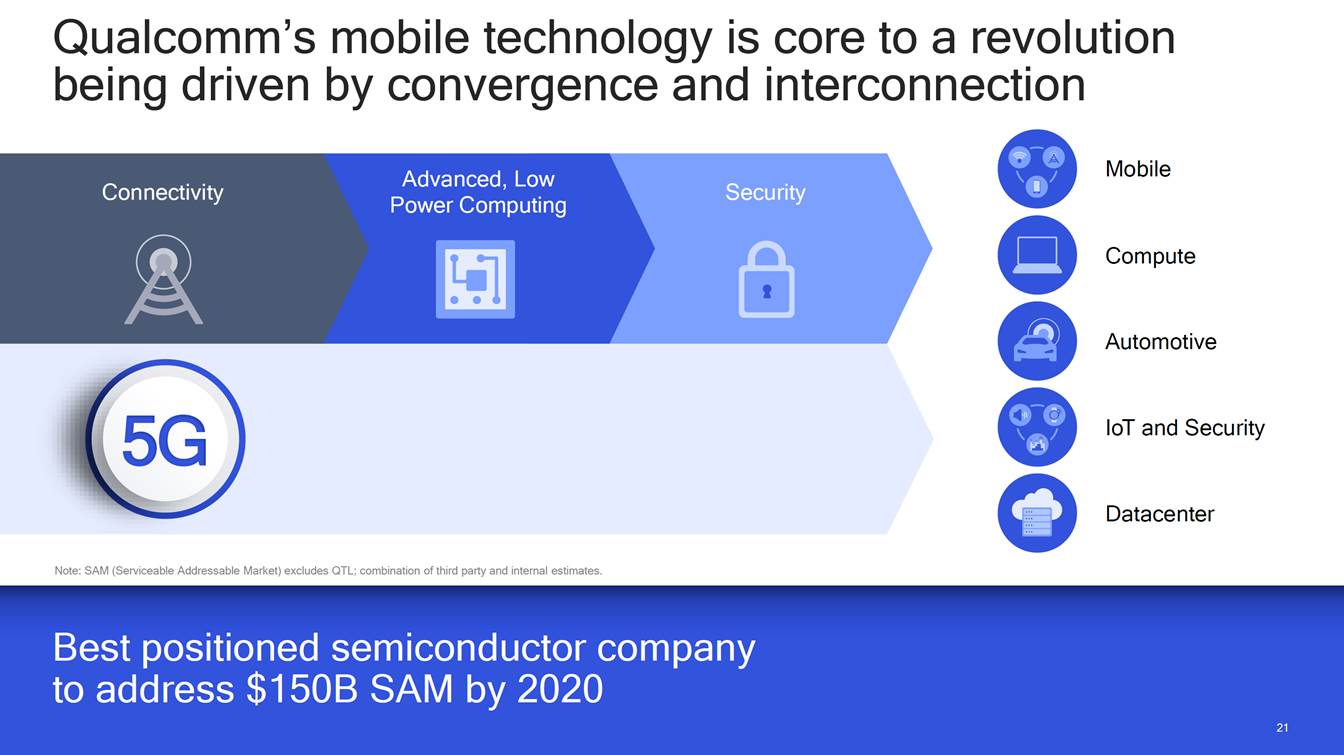
Qualcomm’s being driven mobile technology is core to a revolution by convergence and interconnection Mobile Advanced, Low Power Computing Connectivity Security Compute Automotive 5G IoT and Security Datacenter Note: SAM (Serviceable Addressable Market) excludes QTL; combination of third party and internal estimates. to address $150B SAM by 2020 21
QTL Sustainable, High-Margin Business
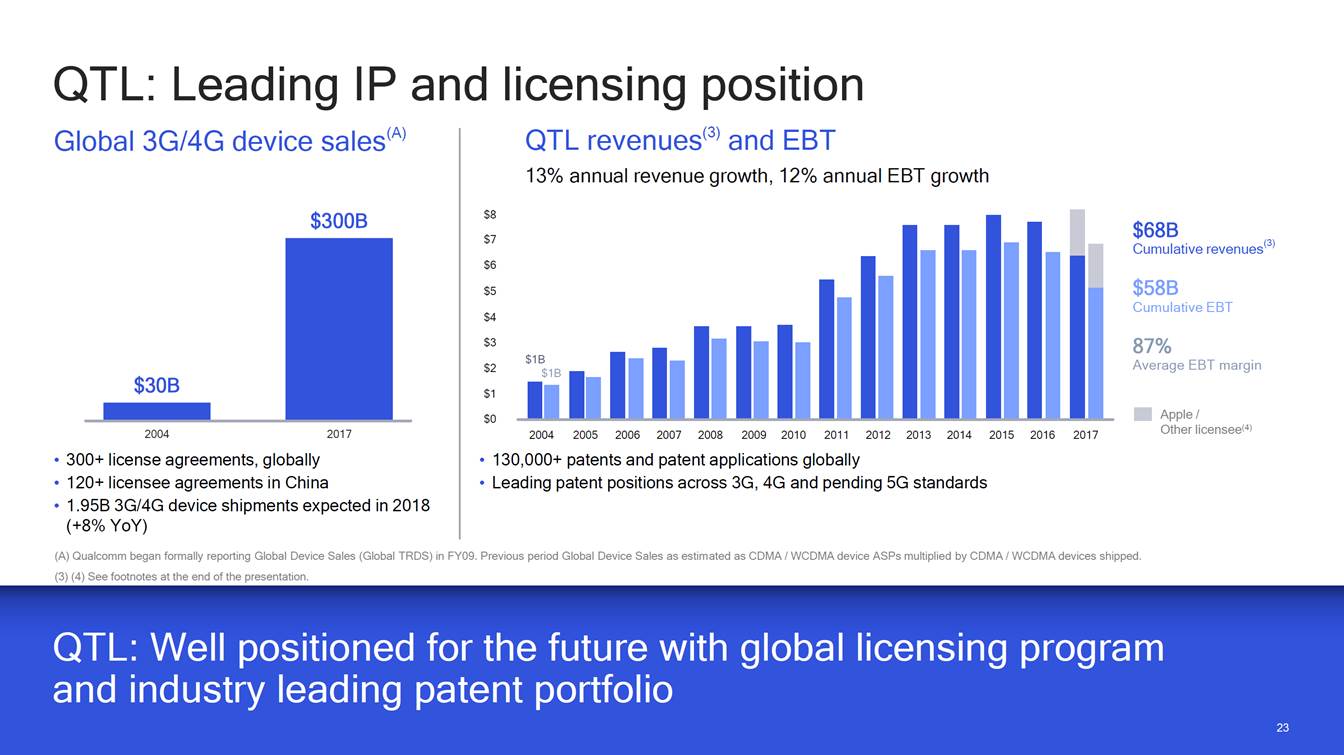
QTL: Leading IP and licensing position QTL revenues(3) and EBT 13% annual revenue growth, 12% annual EBT growth device sales(A) Global 3G/4G $8 $300B $68B Cumulative revenues(3) $7 $6 $58B Cumulative EBT $5 $4 $3 87% Average EBT margin $2 $1 Apple / Other licensee(4) $0 2004 2017 2004 2005 200620072008 20092010 2011201220132014 2015 2016 2017 • 300+ license agreements, globally • 120+ licensee agreements in China • 1.95B 3G/4G device shipments expected in 2018 (+8% YoY) • 130,000+ patents and patent applications globally • Leading patent positions across 3G, 4G and pending 5G standards (A) Qualcomm began formally reporting Global Device Sales (Global TRDS) in FY09. Previous period Global Device Sales as estimated as CDMA / WCDMA device ASPs multiplied by CDMA / WCDMA devices shipped. . (3) (4) See footnotes at the end of the presentation. and industry leading patent portfolio 23 $30B $1B $1B
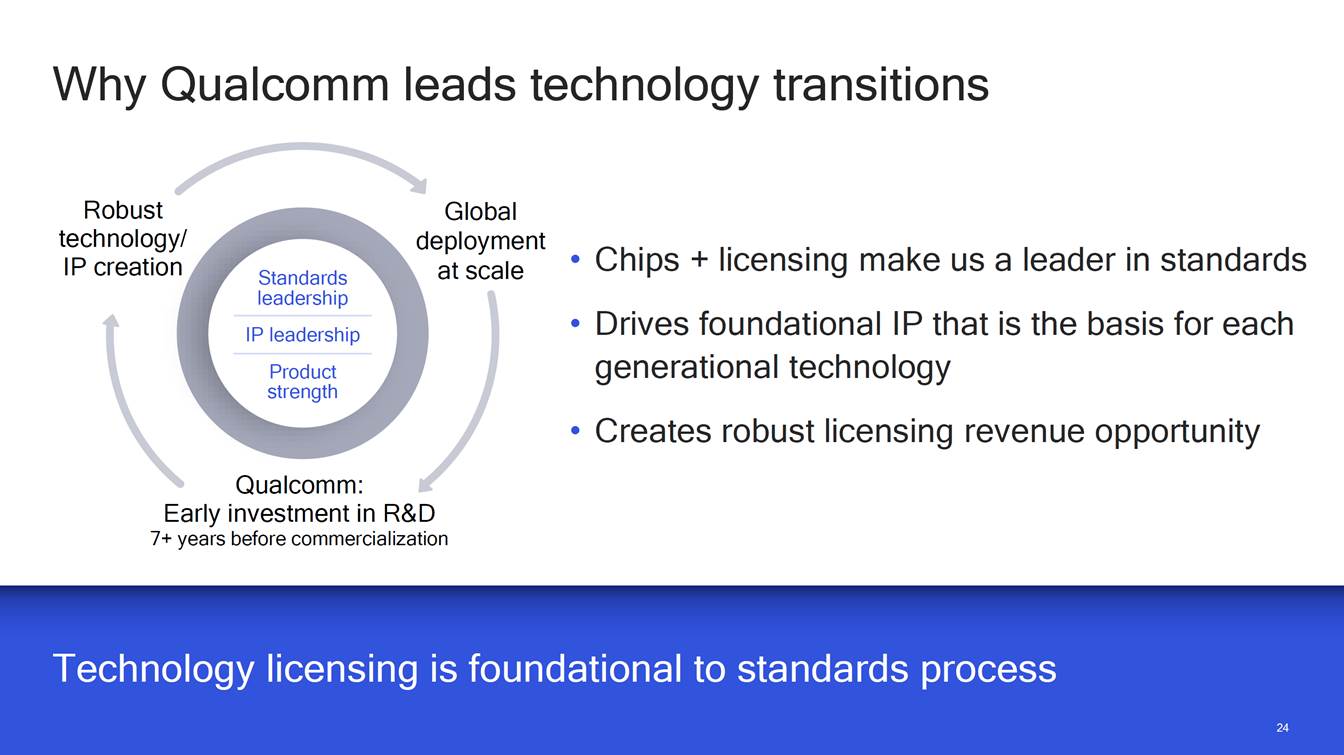
Why Qualcomm leads technology transitions Robust technology/ IP creation Global deployment at scale • • Chips + licensing make us a leader in standards Drives foundational IP that is the basis for each generational technology Standards leadership IP leadership Product strength Creates robust licensing revenue opportunity • Qualcomm: Early investment in R&D 7+ years before commercialization Technology licensing is foundational to standards process 24
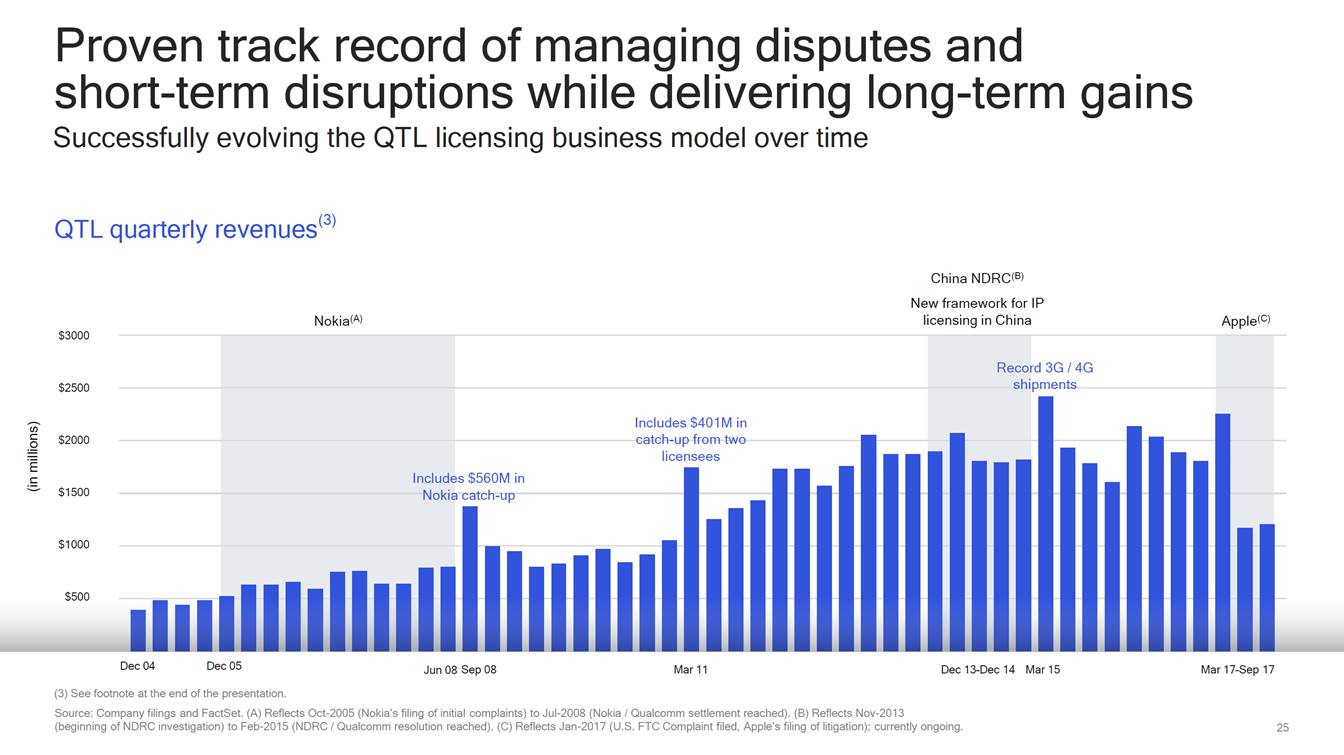
Proven track record of managing disputes and short-term disruptions while delivering long-term gains Successfully evolving the QTL licensing business model over time QTL quarterly revenues(3) China NDRC(B) New framework for IP licensing in China Nokia(A) Apple(C) $3000 ord 3G / 4G $2500 catch-up from two $2000 es $560M in $1500 Nokia catch-up $1000 $500 Dec 04 Dec 05 Jun 08 Sep 08 Mar 11 Dec 13–Dec 14 Mar 15 Mar 17–Sep 17 (3) See footnote at the end of the presentation. Source: Company filings and FactSet. (A) Reflects Oct-2005 (Nokia’s filing of initial complaints) to Jul-2008 (Nokia / Qualcomm settlement reached). (B) Reflects Nov-2013 (beginning of NDRC investigation) to Feb-2015 (NDRC / Qualcomm resolution reached). (C) Reflects Jan-2017 (U.S. FTC Complaint filed, Apple’s filing of litigation); currently ongoing. 25 (in millions) Rec shi pments Includes $401M in Includ licensees
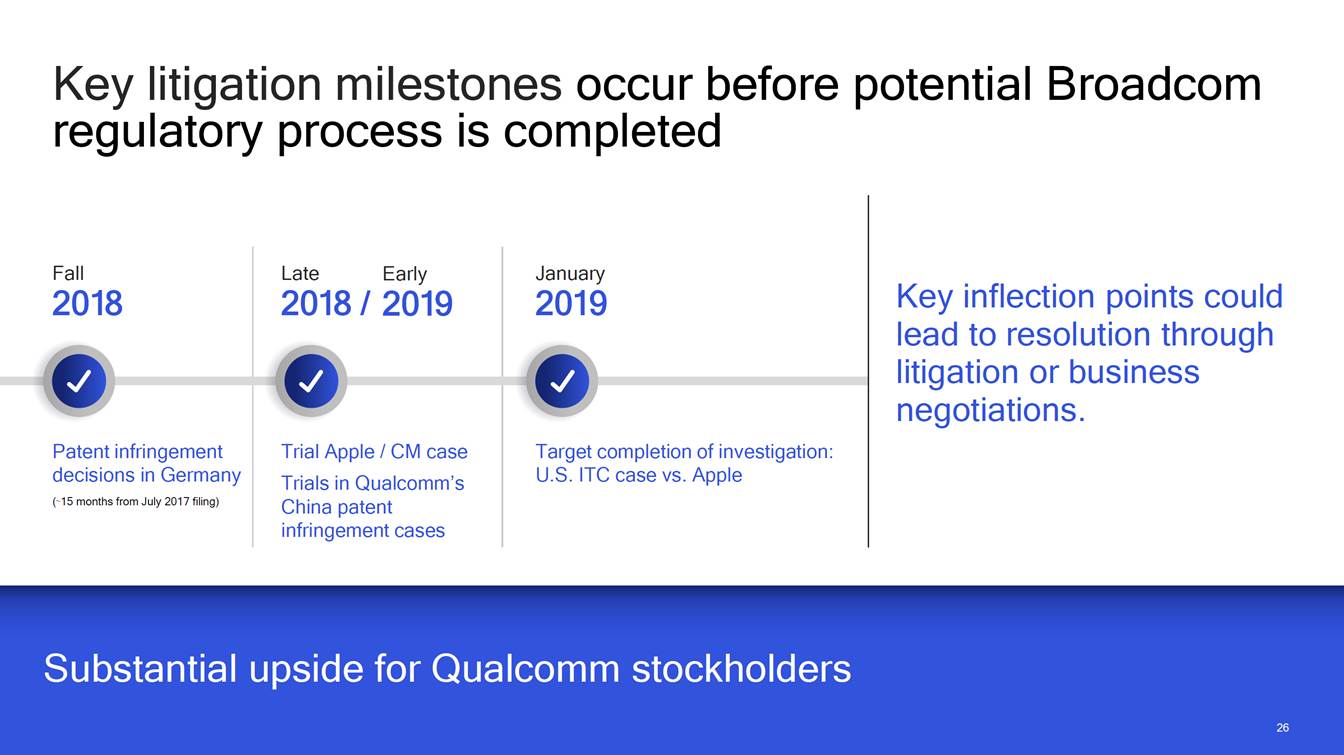
Key litigation milestones occur before regulatory process is completed potential Broadcom Fall 2018 Late Early January 2019 Key inflection points could lead to resolution through litigation or business negotiations. 2018 / 2019 Patent infringement decisions in Germany (~15 months from July 2017 filing) Trial Apple / CM case Trials in Qualcomm’s China patent infringement cases Target completion of investigation: U.S. ITC case vs. Apple Substantial upside for Qualcomm stockholders 26
Highly Board Qualified Depth and Breadth of Experience

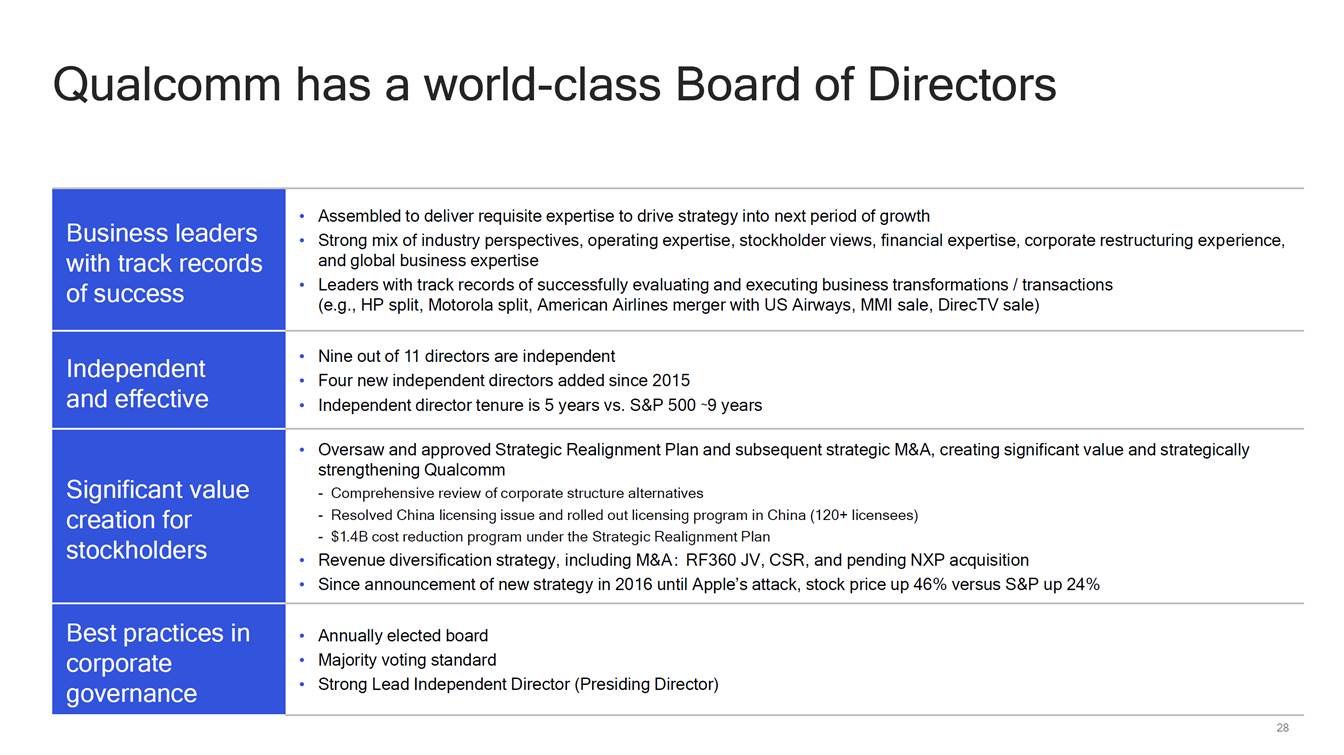
Qualcomm has a world-class Board of Directors • Strong mix of industry perspectives, operating expertise, stockholder views, financial expertise, corporate restructuring experience, (e.g., HP split, Motorola split, American Airlines merger with US Airways, MMI sale, DirecTV sale) • Four new independent directors added since 2015 - Comprehensive review of corporate structure alternatives - $1.4B cost reduction program under the Strategic Realignment Plan 28 Business leaders with track records of success • Assembled to deliver requisite expertise to drive strategy into next period of growth and global business expertise • Leaders with track records of successfully evaluating and executing business transformations / transactions Independent and effective • Nine out of 11 directors are independent • Independent director tenure is 5 years vs. S&P 500 ~9 years Significant value creation for stockholders • Oversaw and approved Strategic Realignment Plan and subsequent strategic M&A, creating significant value and strategically strengthening Qualcomm - Resolved China licensing issue and rolled out licensing program in China (120+ licensees) • Revenue diversification strategy, including M&A : RF360 JV, CSR, and pending NXP acquisition • Since announcement of new strategy in 2016 until Apple’s attack, stock price up 46% versus S&P up 24% Best practices in corporate governance • Annually elected board • Majority voting standard • Strong Lead Independent Director (Presiding Director)
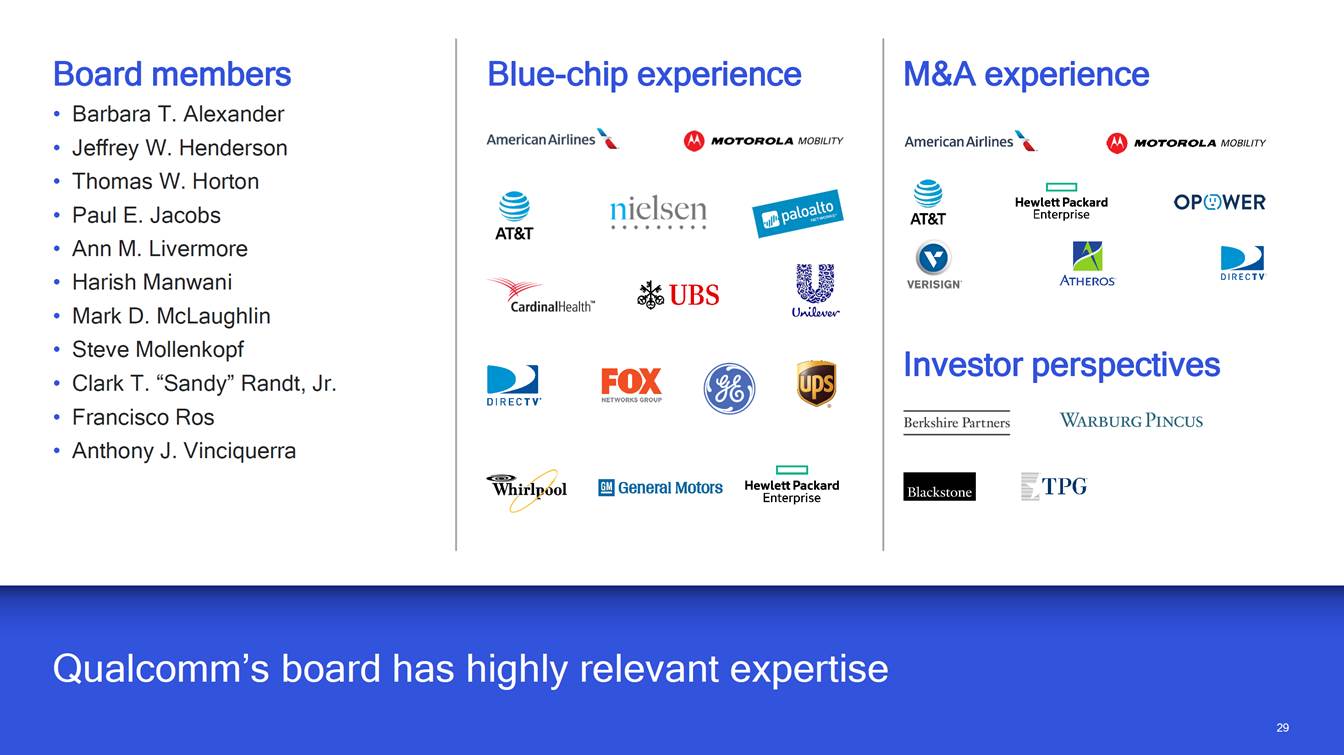
Board members Blue-chip experience M&A experience • • • • • • • • • • • Barbara T. Alexander Jeffrey W. Henderson Thomas W. Horton Paul E. Jacobs Ann M. Livermore Harish Manwani Mark D. McLaughlin Steve Mollenkopf Clark T. “Sandy” Randt, Jr. Francisco Ros Anthony J. Vinciquerra Investor perspectives Qualcomm’s board has highly relevant expertise 29
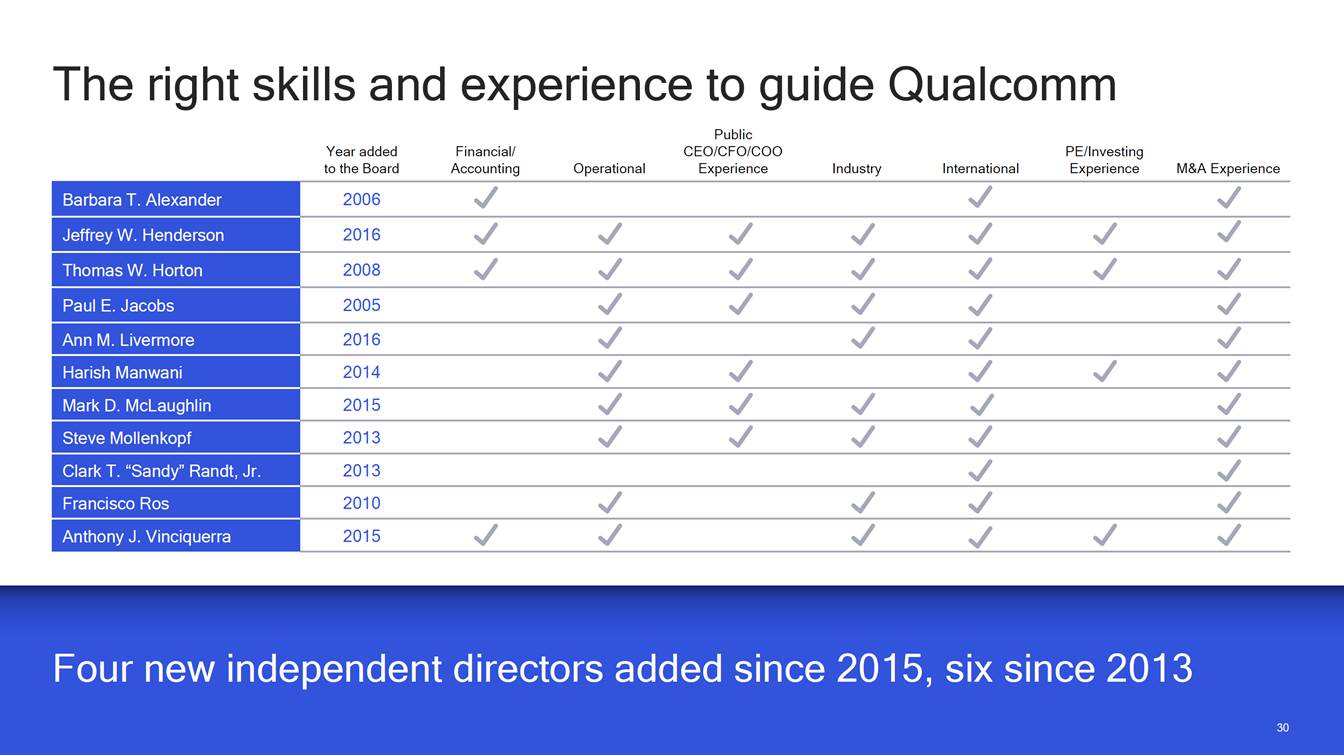
The right skills and experience to guide Qualcomm Public Year added to the Board Financial/ Accounting CEO/CFO/COO Experience PE/Investing Experience Operational Industry International M&A Experience Four new independent directors added since 2015, six since 2013 30 Barbara T. Alexander 2006 Jeffrey W. Henderson 2016 Thomas W. Horton 2008 Paul E. Jacobs 2005 Ann M. Livermore 2016 Harish Manwani 2014 Mark D. McLaughlin 2015 Steve Mollenkopf 2013 Clark T. “Sandy” Randt, Jr. 2013 Francisco Ros 2010 Anthony J. Vinciquerra 2015
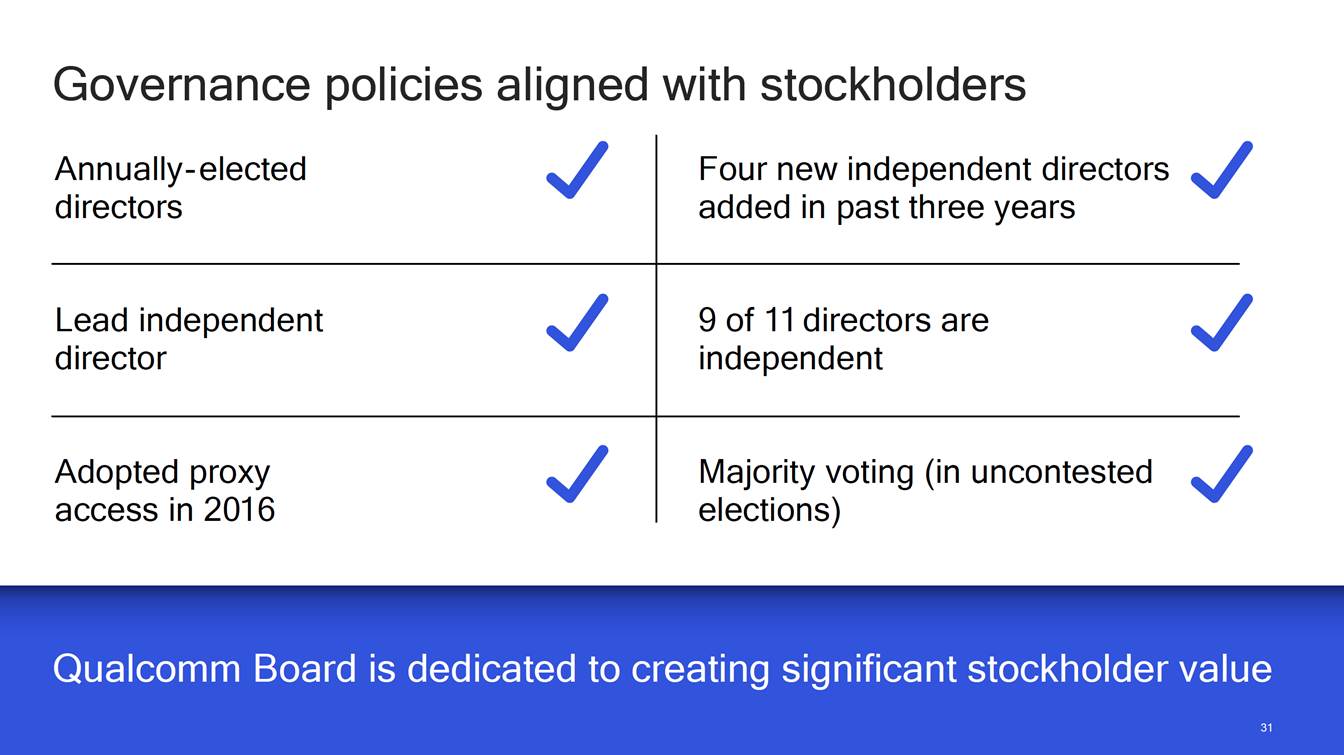
Governance policies aligned with stockholders Qualcomm Board is dedicated to creating significant stockholder value 31 31 Annually-elected directors Four new independent directors added in past three years Lead independent director 9 of 11 directors are independent Adopted proxy access in 2016 Majority voting (in uncontested elections)
Broadcom Proposal: and Low High Value Risk Substantial regulatory risk
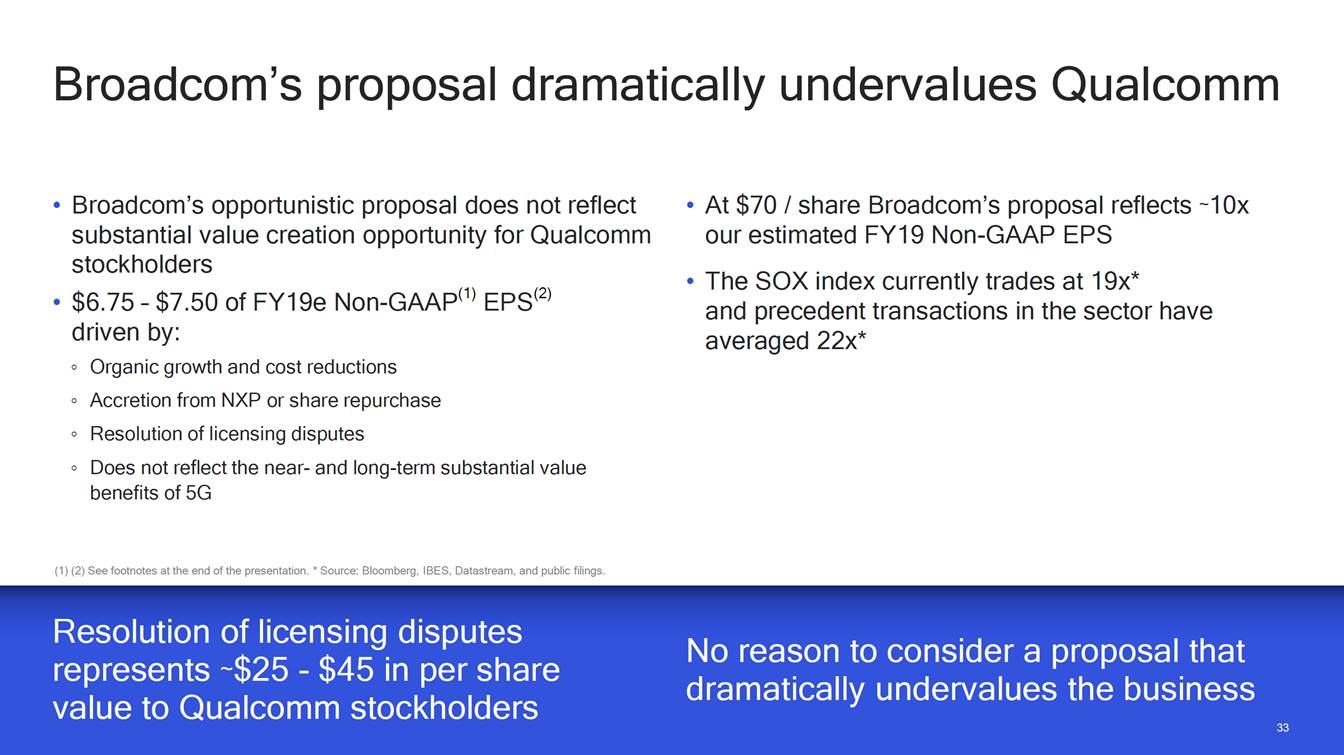
Broadcom’s proposal dramatically undervalues Qualcomm • Broadcom’s opportunistic proposal does not reflect substantial value creation opportunity for Qualcomm stockholders $6.75 – $7.50 of FY19e Non-GAAP(1) EPS(2) driven by: • At $70 / share Broadcom’s proposal reflects ~10x our estimated FY19 Non-GAAP EPS The SOX index currently trades at 19x* and precedent transactions in the sector have averaged 22x* • • Organic growth and cost reductions Accretion from NXP or share repurchase Resolution of licensing disputes Does not reflect the near-and long-term substantial value benefits of 5G (1) (2) See footnotes at the end of the presentation. * Source: Bloomberg, IBES, Datastream, and public filings. No reason to consider a proposal that represents ~$25 - $45 in per share value to Qualcomm stockholders dramatically undervalues the business 33
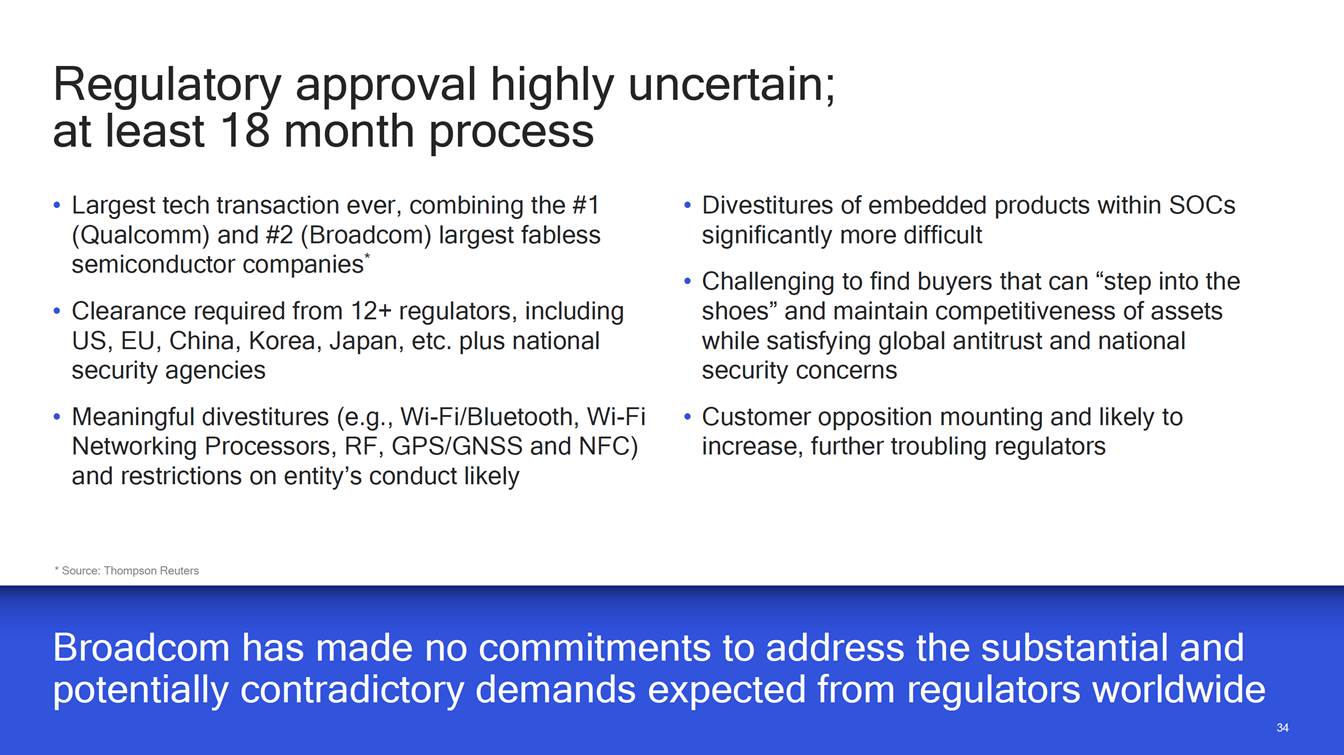
Regulatory approval highly at least 18 month process uncertain; • Largest tech transaction ever, combining the #1 (Qualcomm) and #2 (Broadcom) largest fabless semiconductor companies* Clearance required from 12+ regulators, including US, EU, China, Korea, Japan, etc. plus national security agencies Meaningful divestitures (e.g., Wi-Fi/Bluetooth, Wi-Fi Networking Processors, RF, GPS/GNSS and NFC) and restrictions on entity’s conduct likely • Divestitures of embedded products within SOCs significantly more difficult Challenging to find buyers that can “step into the shoes” and maintain competitiveness of assets while satisfying global antitrust and national security concerns • • • • Customer opposition mounting and likely increase, further troubling regulators to * Source: Thompson Reuters potentially contradictory demands expected from regulators worldwide 34
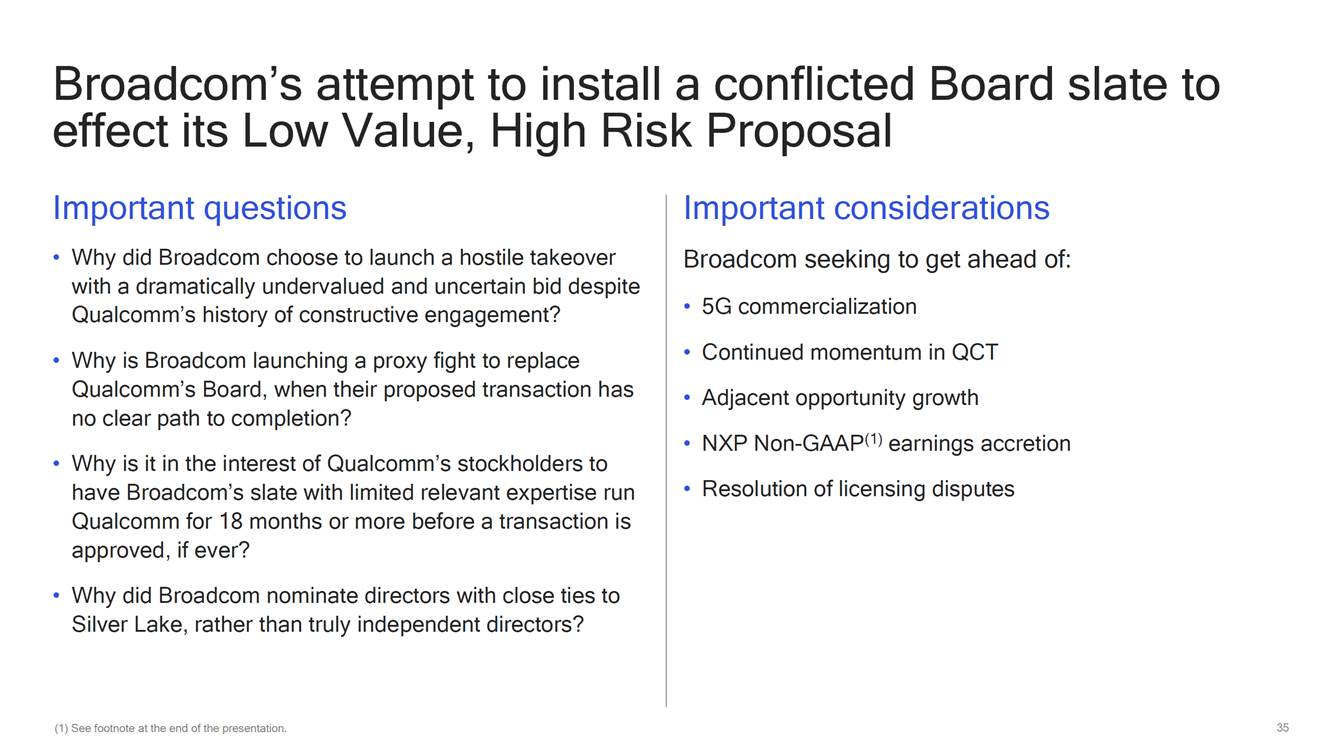
Broadcom’s attempt to install a conflicted Board slate effect its Low Value, High Risk Proposal to Important questions Important considerations Broadcom seeking to get ahead of: • Why did Broadcom choose to launch a hostile takeover with a dramatically undervalued and uncertain bid despite Qualcomm’s history of constructive engagement? • 5G commercialization • • Continued momentum in QCT Adjacent opportunity growth NXP Non-GAAP(1) earnings accretion Resolution of licensing disputes • Why is Broadcom launching a proxy fight to replace Qualcomm’s Board, when their proposed transaction has no clear path to completion? Why is it in the interest of Qualcomm’s stockholders to have Broadcom’s slate with limited relevant expertise run Qualcomm for 18 months or more before a transaction is approved, if ever? • • • • Why did Broadcom nominate directors with close ties to Silver Lake, rather than truly independent directors? 35 (1) See footnote at the end of the presentation.
Conclusion

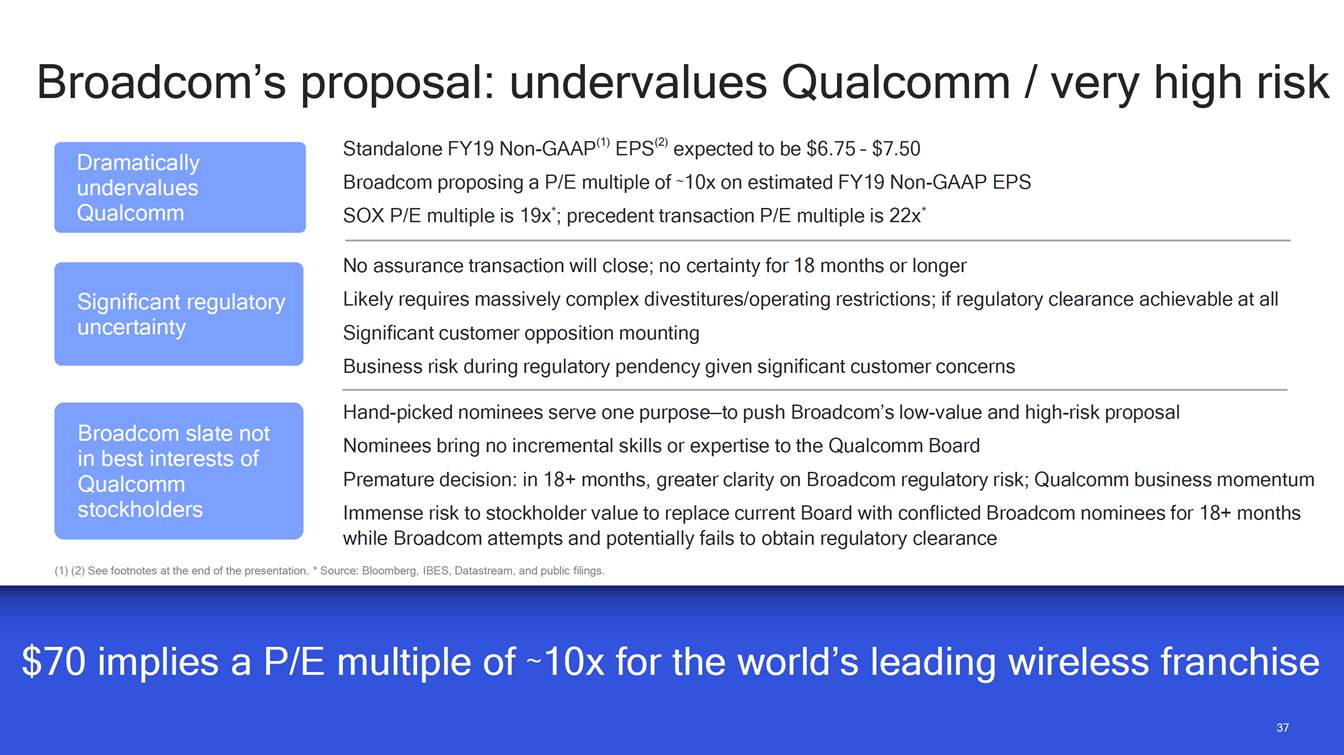
Broadcom’s Dramatically undervalues Qualcomm proposal: undervalues Qualcomm / very high risk Standalone FY19 Non-GAAP(1) EPS(2) expected to be $6.75 – $7.50 Broadcom proposing a P/E multiple of ~10x on estimated FY19 Non-GAAP EPS SOX P/E multiple is 19x*; precedent transaction P/E multiple is 22x* No assurance transaction will close; no certainty for 18 months or longer Likely requires massively complex divestitures/operating restrictions; if regulatory clearance achievable at all Significant customer opposition mounting Business risk during regulatory pendency given significant customer concerns Significant regulatory uncertainty Hand-picked nominees serve one purpose—to push Broadcom’s low-value and high-risk proposal Nominees bring no incremental skills or expertise to the Qualcomm Board Premature decision: in 18+ months, greater clarity on Broadcom regulatory risk; Qualcomm business momentum Immense risk to stockholder value to replace current Board with conflicted Broadcom nominees for 18+ months while Broadcom attempts and potentially fails to obtain regulatory clearance Broadcom slate not in best interests of Qualcomm stockholders (1) (2) See footnotes at the end of the presentation. * Source: Bloomberg, IBES, Datastream, and public filings. $70 implies a P/E multiple of ~10x for the world’s leading wireless franchise 37
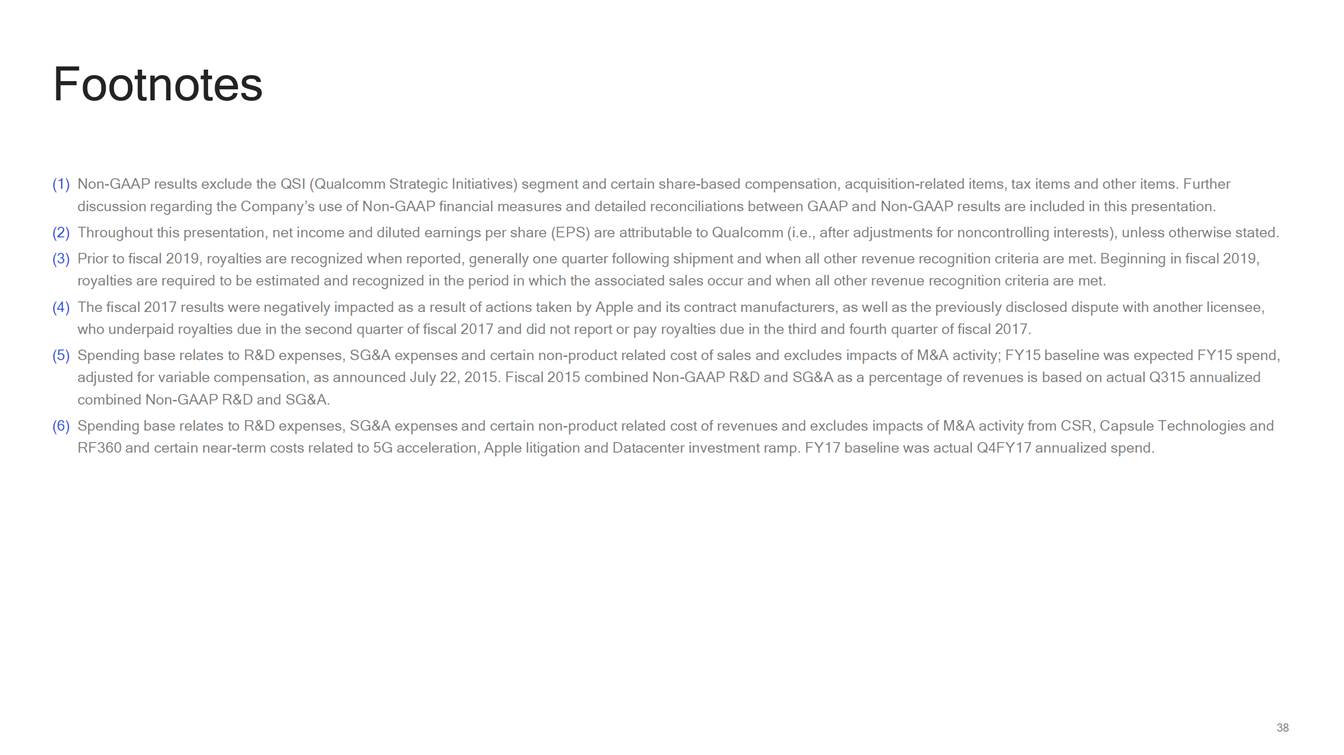
Footnotes (1) Non-GAAP results exclude the QSI (Qualcomm Strategic Initiatives) segment and certain share-based compensation, acquisition-related items, tax items and other items. Further discussion regarding the Company’s use of Non-GAAP financial measures and detailed reconciliations between GAAP and Non-GAAP results are included in this presentation. Throughout this presentation, net income and diluted earnings per share (EPS) are attributable to Qualcomm (i.e., after adjustments for noncontrolling interests), unless otherwise stated. Prior to fiscal 2019, royalties are recognized when reported, generally one quarter following shipment and when all other revenue recognition criteria are met. Beginning in fiscal 2019, royalties are required to be estimated and recognized in the period in which the associated sales occur and when all other revenue recognition criteria are met. The fiscal 2017 results were negatively impacted as a result of actions taken by Apple and its contract manufacturers, as well as the previously disclosed dispute with another licensee, who underpaid royalties due in the second quarter of fiscal 2017 and did not report or pay royalties due in the third and fourth quarter of fiscal 2017. Spending base relates to R&D expenses, SG&A expenses and certain non-product related cost of sales and excludes impacts of M&A activity; FY15 baseline was expected FY15 spend, adjusted for variable compensation, as announced July 22, 2015. Fiscal 2015 combined Non-GAAP R&D and SG&A as a percentage of revenues is based on actual Q315 annualized combined Non-GAAP R&D and SG&A. Spending base relates to R&D expenses, SG&A expenses and certain non-product related cost of revenues and excludes impacts of M&A activity from CSR, Capsule Technologies and RF360 and certain near-term costs related to 5G acceleration, Apple litigation and Datacenter investment ramp. FY17 baseline was actual Q4FY17 annualized spend. (2) (3) (4) (5) (6) 38
Reconciliations

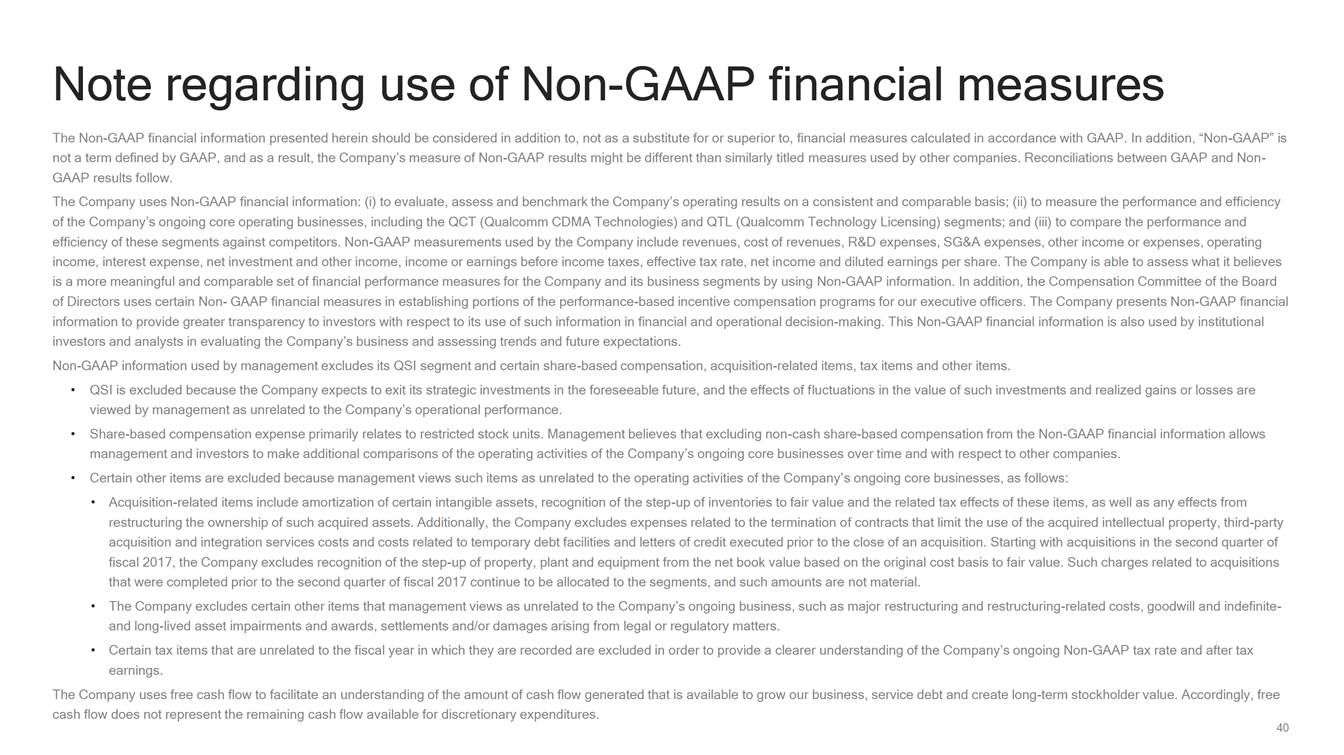
Note regarding use of Non-GAAP financial measures The Non-GAAP financial information presented herein should be considered in addition to, not as a substitute for or superior to, financial measures calculated in accordance with GAAP. In addition, “Non-GAAP” is not a term defined by GAAP, and as a result, the Company’s measure of Non-GAAP results might be different than similarly titled measures used by other companies. Reconciliations between GAAP and Non-GAAP results follow. The Company uses Non-GAAP financial information: (i) to evaluate, assess and benchmark the Company’s operating results on a consistent and comparable basis; (ii) to measure the performance and efficiency of the Company’s ongoing core operating businesses, including the QCT (Qualcomm CDMA Technologies) and QTL (Qualcomm Technology Licensing) segments; and (iii) to compare the performance and efficiency of these segments against competitors. Non-GAAP measurements used by the Company include revenues, cost of revenues, R&D expenses, SG&A expenses, other income or expenses, operating income, interest expense, net investment and other income, income or earnings before income taxes, effective tax rate, net income and diluted earnings per share. The Company is able to assess what it believes is a more meaningful and comparable set of financial performance measures for the Company and its business segments by using Non-GAAP information. In addition, the Compensation Committee of the Board of Directors uses certain Non-GAAP financial measures in establishing portions of the performance-based incentive compensation programs for our executive officers. The Company presents Non-GAAP financial information to provide greater transparency to investors with respect to its use of such information in financial and operational decision-making. This Non-GAAP financial information is also used by institutional investors and analysts in evaluating the Company’s business and assessing trends and future expectations. Non-GAAP information used by management excludes its QSI segment and certain share-based compensation, acquisition-related items, tax items and other items. • QSI is excluded because the Company expects to exit its strategic investments in the foreseeable future, and the effects of fluctuations in the value of such investments and realized gains or losses are viewed by management as unrelated to the Company’s operational performance. Share-based compensation expense primarily relates to restricted stock units. Management believes that excluding non-cash share-based compensation from the Non-GAAP financial information allows management and investors to make additional comparisons of the operating activities of the Company’s ongoing core businesses over time and with respect to other companies. Certain other items are excluded because management views such items as unrelated to the operating activities of the Company’s ongoing core businesses, as follows: • • • Acquisition-related items include amortization of certain intangible assets, recognition of the step-up of inventories to fair value and the related tax effects of these items, as well as any effects from restructuring the ownership of such acquired assets. Additionally, the Company excludes expenses related to the termination of contracts that limit the use of the acquired intellectual property, third-party acquisition and integration services costs and costs related to temporary debt facilities and letters of credit executed prior to the close of an acquisition. Starting with acquisitions in the second quarter of fiscal 2017, the Company excludes recognition of the step-up of property, plant and equipment from the net book value based on the original cost basis to fair value. Such charges related to acquisitions that were completed prior to the second quarter of fiscal 2017 continue to be allocated to the segments, and such amounts are not material. The Company excludes certain other items that management views as unrelated to the Company’s ongoing business, such as major restructuring and restructuring-related costs, goodwill and indefinite-and long-lived asset impairments and awards, settlements and/or damages arising from legal or regulatory matters. Certain tax items that are unrelated to the fiscal year in which they are recorded are excluded in order to provide a clearer understanding of the Company’s ongoing Non-GAAP tax rate and after tax earnings. • • The Company uses free cash flow to facilitate an understanding of the amount of cash flow generated that is available to grow our business, service debt and create long-term stockholder value. Accordingly, free cash flow does not represent the remaining cash flow available for discretionary expenditures. 40
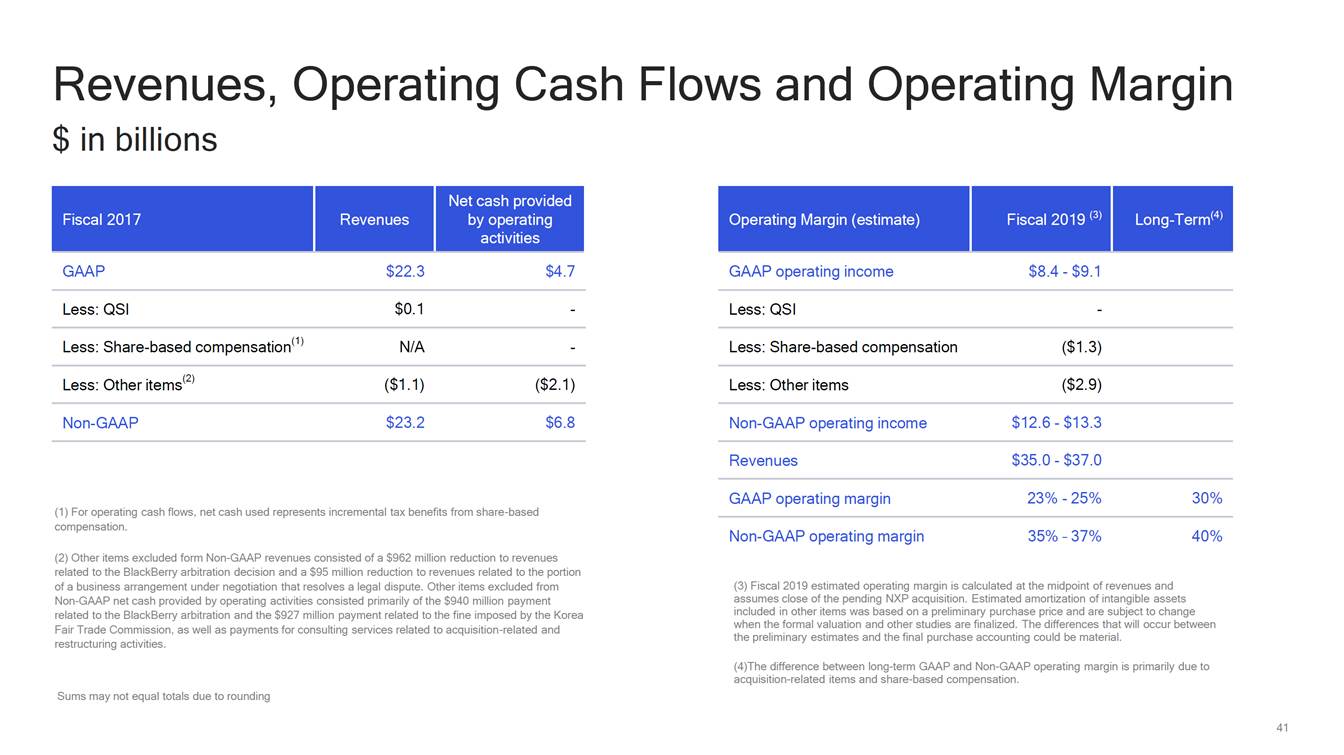
Revenues, $ in billions Operating Cash Flows and Operating Margin GAAP $22.3 $4.7 GAAP operating income $8.4 - $9.1 Less: QSI $0.1 - Less: QSI - Less: Share-based compensation(1) N/A - Less: Share-based compensation ($1.3) Less: Other items(2) ($1.1) ($2.1) Less: Other items ($2.9) Non-GAAP $23.2 $6.8 Non-GAAP operating income $12.6 - $13.3 Revenues $35.0 - $37.0 GAAP operating margin 23% - 25% 30% (1) For operating cash flows, net cash used represents incremental tax benefits from share-based compensation. Non-GAAP operating margin 35% – 37% 40% (2) Other items excluded form Non-GAAP revenues consisted of a $962 million reduction to revenues related to the BlackBerry arbitration decision and a $95 million reduction to revenues related to the portion of a business arrangement under negotiation that resolves a legal dispute. Other items excluded from Non-GAAP net cash provided by operating activities consisted primarily of the $940 million payment related to the BlackBerry arbitration and the $927 million payment related to the fine imposed by the Korea Fair Trade Commission, as well as payments for consulting services related to acquisition-related and restructuring activities. (3) Fiscal 2019 estimated operating margin is calculated at the midpoint of revenues and assumes close of the pending NXP acquisition. Estimated amortization of intangible assets included in other items was based on a preliminary purchase price and are subject to change when the formal valuation and other studies are finalized. The differences that will occur between the preliminary estimates and the final purchase accounting could be material. (4)The difference between long-term GAAP and Non-GAAP operating margin is primarily due to acquisition-related items and share-based compensation. Sums may not equal totals due to rounding 41 Operating Margin (estimate) Fiscal 2019 (3) Long-Term(4) Fiscal 2017 Revenues Net cash provided by operating activities
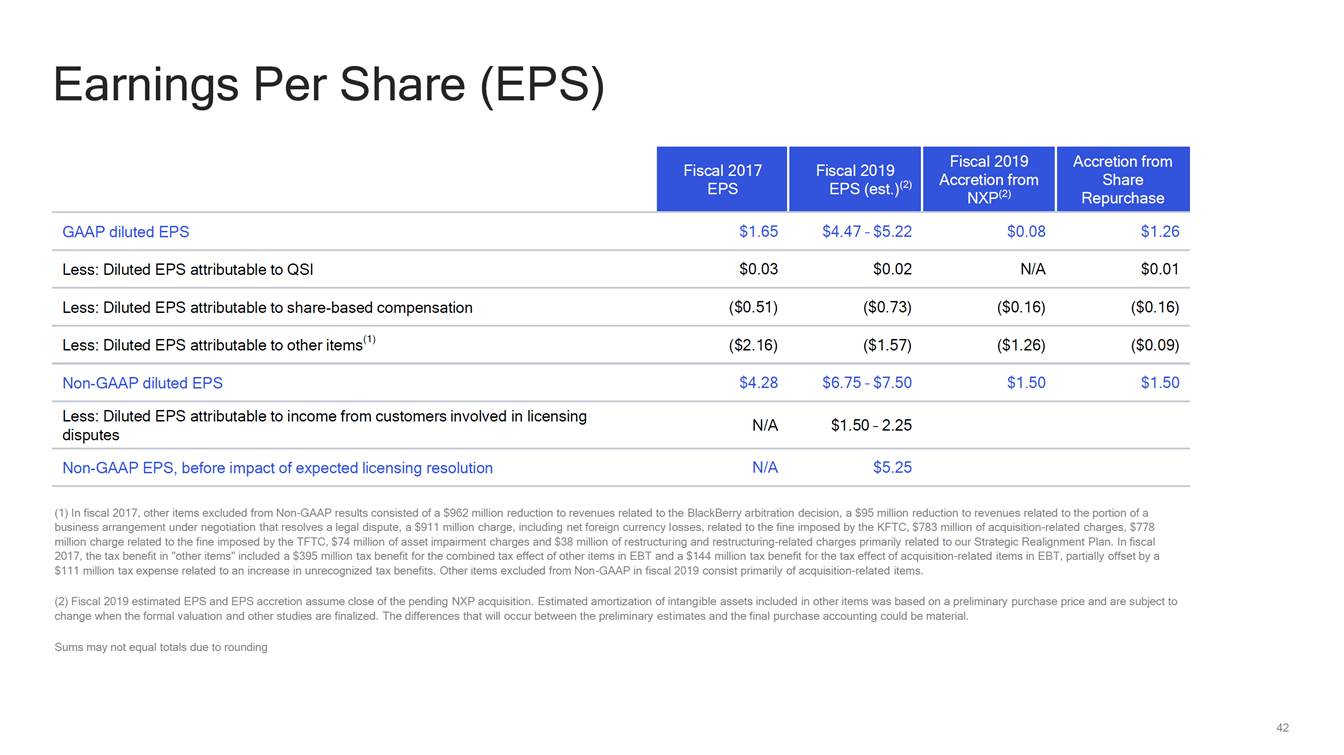
Earnings Per Share (EPS) Share GAAP diluted EPS $1.65 $4.47 – $5.22 $0.08 $1.26 Less: Diluted EPS attributable to QSI $0.03 $0.02 N/A $0.01 Less: Diluted EPS attributable to share-based compensation ($0.51) ($0.73) ($0.16) ($0.16) Less: Diluted EPS attributable to other items(1) ($2.16) ($1.57) ($1.26) ($0.09) Non-GAAP diluted EPS $4.28 $6.75 – $7.50 $1.50 $1.50 Less: Diluted EPS attributable to income from customers involved in licensing disputes N/A $1.50 – 2.25 Non-GAAP EPS, before impact of expected licensing resolution N/A $5.25 (1) In fiscal 2017, other items excluded from Non-GAAP results consisted of a $962 million reduction to revenues related to the BlackBerry arbitration decision, a $95 million reduction to revenues related to the portion of a business arrangement under negotiation that resolves a legal dispute, a $911 million charge, including net foreign currency losses, related to the fine imposed by the KFTC, $783 million of acquisition-related charges, $778 million charge related to the fine imposed by the TFTC, $74 million of asset impairment charges and $38 million of restructuring and restructuring-related charges primarily related to our Strategic Realignment Plan. In fiscal 2017, the tax benefit in "other items" included a $395 million tax benefit for the combined tax effect of other items in EBT and a $144 million tax benefit for the tax effect of acquisition-related items in EBT, partially offset by a $111 million tax expense related to an increase in unrecognized tax benefits. Other items excluded from Non-GAAP in fiscal 2019 consist primarily of acquisition-related items. (2) Fiscal 2019 estimated EPS and EPS accretion assume close of the pending NXP acquisition. Estimated amortization of intangible assets included in other items was based on a preliminary purchase price and are subject to change when the formal valuation and other studies are finalized. The differences that will occur between the preliminary estimates and the final purchase accounting could be material. Sums may not equal totals due to rounding 42 Fiscal 2017 EPS Fiscal 2019 EPS (est.)(2) Fiscal 2019 Accretion from NXP(2) Accretion from Repurchase
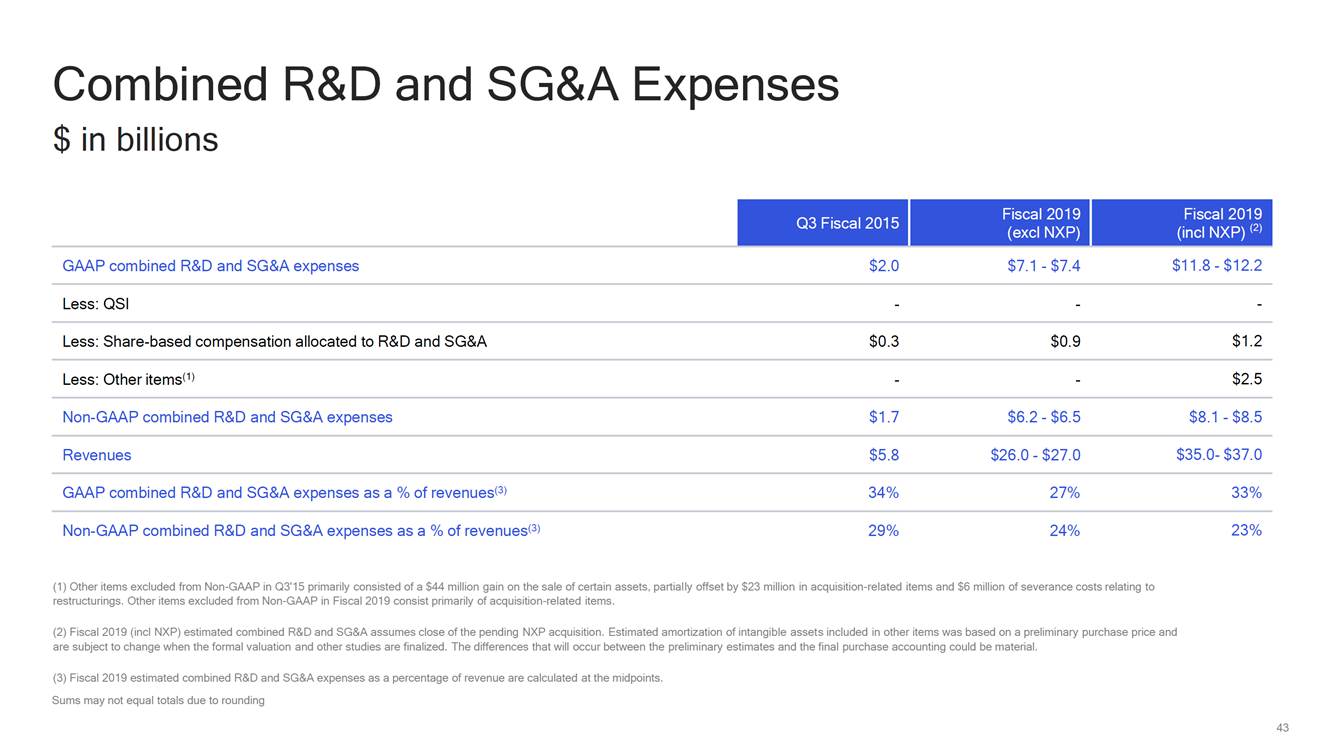
Combined R&D $ in billions and SG&A Expenses (incl NXP) (2) GAAP combined R&D and SG&A expenses $2.0 $7.1 - $7.4 $11.8 - $12.2 Less: QSI - - - Less: Share-based compensation allocated to R&D and SG&A $0.3 $0.9 $1.2 Less: Other items(1) - - $2.5 Non-GAAP combined R&D and SG&A expenses $1.7 $6.2 - $6.5 $8.1 - $8.5 Revenues $5.8 $26.0 - $27.0 $35.0-$37.0 GAAP combined R&D and SG&A expenses as a % of revenues(3) 34% 27% 33% Non-GAAP combined R&D and SG&A expenses as a % of revenues(3) 29% 24% 23% (1) Other items excluded from Non-GAAP in Q3'15 primarily consisted of a $44 million gain on the sale of certain assets, partially offset by $23 million in acquisition-related items and $6 million of severance costs relating to restructurings. Other items excluded from Non-GAAP in Fiscal 2019 consist primarily of acquisition-related items. (2) Fiscal 2019 (incl NXP) estimated combined R&D and SG&A assumes close of the pending NXP acquisition. Estimated amortization of intangible assets included in other items was based on a preliminary purchase price and are subject to change when the formal valuation and other studies are finalized. The differences that will occur between the preliminary estimates and the final purchase accounting could be material. (3) Fiscal 2019 estimated combined R&D and SG&A expenses as a percentage of revenue are calculated at the midpoints. Sums may not equal totals due to rounding 43 Q3 Fiscal 2015 Fiscal 2019 (excl NXP) Fiscal 2019
Please Vote the WHITE Proxy Card Thank You for Follow us on: For more information, visit us at: www.qcomvalue.com Your Support Nothing in these materials is an offer to sell any of the components or devices referenced herein. References in this presentation to “Qualcomm” may mean Qualcomm Incorporated, Qualcomm Technologies, Inc., and/or other subsidiaries or business units within the Qualcomm corporate structure, as applicable. Qualcomm Incorporated includes Qualcomm’s licensing business, QTL, and the vast majority of its patent portfolio. Qualcomm Technologies, Inc., a wholly-owned subsidiary of Qualcomm Incorporated, operates, along with its subsidiaries, all of Qualcomm’s engineering, research and development functions, and substantially all of its product and services businesses, including its semiconductor business, QCT. ©2018 Qualcomm Technologies, Inc. and/or its affiliated companies. All Rights Reserved. Qualcomm is a trademark of Qualcomm Incorporated, registered in the United States and other countries. Other products and brand names may be trademarks or registered trademarks of their respective owners.