
UNITED STATES
SECURITIES AND EXCHANGE COMMISSION
Washington, DC 20549
SCHEDULE 14A INFORMATION
PROXY STATEMENT PURSUANT TO SECTION 14(a) OF THE
SECURITIES EXCHANGE ACT OF 1934
(AMENDMENT NO. )
Filed by the Registrant x Filed by a Party other than the Registrant ¨
Check the appropriate box:
| ¨ | Preliminary Proxy Statement | |||
| ¨ | Confidential, for Use of the Commission Only (as permitted by Rule 14a-6(e)(2)) | |||
| ¨ | Definitive Proxy Statement | |||
| x | Definitive Additional Materials | |||
| ¨ | Soliciting Material Pursuant to Section 240.14a-12 | |||
QUALCOMM INCORPORATED | ||||
| (Name of Registrant as Specified In Its Charter) | ||||
| (Name of Person(s) Filing Proxy Statement, if other than the Registrant) | ||||
| Payment of Filing Fee (Check the appropriate box): | ||||
| x | No fee required. | |||
| ¨ | Fee computed on table below per Exchange Act Rules 14a-6(i)(1) and 0-11. | |||
| (1) | Title of each class of securities to which transaction applies:
| |||
|
| ||||
| (2) | Aggregate number of securities to which transaction applies:
| |||
|
| ||||
| (3) | Per unit price or other underlying value of transaction computed pursuant to Exchange Act Rule 0-11 (set forth the amount on which the filing fee is calculated and state how it was determined):
| |||
|
| ||||
| (4) | Proposed maximum aggregate value of transaction:
| |||
|
| ||||
| (5) | Total fee paid: | |||
|
| ||||
| ¨ | Fee paid previously with preliminary materials. | |||
| ¨ | Check box if any part of the fee is offset as provided by Exchange Act Rule 0-11(a)(2) and identify the filing for which the offsetting fee was paid previously. Identify the previous filing by registration statement number, or the Form or Schedule and the date of its filing. | |||
| (1) | Amount Previously Paid:
| |||
|
| ||||
| (2) | Form, Schedule or Registration Statement No.:
| |||
|
| ||||
| (3) | Filing Party:
| |||
|
| ||||
| (4) | Date Filed:
| |||
|
| ||||
February 21, 2012
| Re: | Qualcomm’s 2012 Annual Meeting of Stockholders – March 6, 2012 | |
| Proposal 3, Advisory Vote on Executive Compensation (“Say on Pay”) |
Dear Stockholder:
By now you should have received Qualcomm’s Notice of the 2012 Annual Meeting and Proxy Statement. You can also view our Proxy Statement at www.qualcomm.com/connect/investor-relations.
We are writing to ask for your support at the Annual Meeting by voting in accordance with the recommendations of our Board of Directors on all proposals. In particular, we want to request your support on Proposal 3, Advisory Vote on Executive Compensation (“Say on Pay”).
Institutional Shareholder Services (ISS) has recommended a vote against this proposal. We strongly disagree with its recommendation. ISS based its recommendation largely on the size of our CEO’s equity awards measured against a group of comparator companies determined by ISS. We take issue with the peer group selected by ISS to benchmark our CEO compensation and believe that it fails to recognize that Qualcomm is one of the largest companies in the United States by market capitalization value, and fails to recognize our unique business structure. We understand that ISS policy requires that it takes a standardized approach that identifies comparator companies based on revenues. In contrast, we determined, with input from an independent consultant, our peer group primarily based on market capitalization. This difference in comparator groups is the primary source of the difference between the recommendations of our Board and ISS on the Say on Pay proposal. If ISS had used Qualcomm’s compensation peer group, rather than its policy-generated comparators, we believe we would have passed ISS’ CEO compensation tests.
Our Board believes that market capitalization, rather than revenues, is appropriate as the primary criterion for selecting companies for executive compensation decision-making for the following reasons (which are supported by the tables included in this letter):
| • | Market capitalization, a key component of which is stock price, is the key driver of equity compensation grant value, and equity compensation grant value is the single largest component of CEO compensation among large market capitalization technology companies. |
| • | Market capitalization is directly correlated to shareholder benefit. Qualcomm’s market capitalization is supported more so by our levels of net income and net income margin than revenues which in turn reinforces the appropriateness of this peer group selection criterion (See tables below “Qualcomm Size Ranking” and “Qualcomm Size versus FY11 Compensation Peer Group”). |
1
| • | Market capitalization as the primary selection criterion is more appropriate than revenues. For example, assume companies A and B have identical revenues of $15 billion and both have 1 billion shares outstanding, but company A’s market capitalization is $10 billion (i.e., a $10 per share stock price) as compared to company B’s $100 billion market capitalization (i.e., a $100 per share stock price). It is logical that company B would provide more annual equity grant value to its CEO. However, the ISS analysis suggests that they should be the same because both companies have the same revenues. |
| • | A significant portion of Qualcomm’s business is technology licensing, which is a high margin business, and as such, Qualcomm typically has higher market capitalization and profit than companies with similar revenues. Ironically, this places Qualcomm at a disadvantage under the ISS approach. |
Qualcomm is among the largest and most profitable companies in the S&P 500 and is significantly larger than most companies in the ISS comparator group.
|
Qualcomm Size Ranking1 | ||||||
| Size Measure2 |
S&P
500
Index |
Internal
Compensation
Peer Group3 |
ISS
Comparator
Group | |||
|
Market Capitalization ($ millions) |
27 of 500 |
11 of 28 |
2 of 15 | |||
|
Net Income ($ millions) |
42 of 500 |
11 of 28 |
2 of 15 | |||
|
Net Income Margin (%) |
18 of 500 |
3 of 28 |
4 of 15 | |||
|
Revenues ($ millions)
|
158 of 500
|
21 of 28
|
5 of 15
| |||
| 1 | Based on data from the Standard & Poor’s Research Insight database (effective 1/31/12), which may differ from the financial information as filed with the Securities and Exchange Commission. |
| 2 | Market capitalization is measured as of 9/30/11. Net income, net income margin, and revenues reflect the most recent reported four quarters (as of 1/31/12). |
| 3 | Excludes Motorola, which was subsequently split into two stand-alone public companies. |
With respect to ISS’ analysis, we note that:
| • | We have historically been sensitive to ISS’ guidelines and compensation best practices, including pay for performance tests, in implementing our executive compensation programs. We note that we made the relevant compensation decisions in late 2010, and we believe that we would have passed ISS’ relevant tests that were in effect at that time. |
| • | Among ISS’ 14-company, revenues-focused comparator group Qualcomm is one of the largest companies on all key size measures. Because ISS uses mostly smaller companies in its analysis, it is no surprise that our CEO’s compensation was viewed as being relatively higher. |
Qualcomm Size Ranking1 S&P Internal ISS 500 Compensation Comparator Size Measure2 Index Peer Group3 Group Market Capitalization ($ millions) 27 of 500 11 of 28 2 of 15 Net Income ($ millions) 42 of 500 11 of 28 2 of 15 Net Income Margin (%) 18 of 500 3 of 28 4 of 15 Revenues ($ millions) 158 of 500 21 of 28 5 of 151 Based on data from the Standard & Poor’s Research Insight database (effective 1/31/12), which may differ from the financial information as filed with the Securities and Exchange Commission.
2 Market capitalization is measured as of 9/30/11. Net income, net income margin, and revenues reflect the most recent reported four quarters (as of 1/31/12). 3 Excludes Motorola, which was subsequently split into two stand-alone public companies.
2
| • | Among the 27 peer companies (excluding Motorola due to its recent split into two companies), which we utilize for executive compensation decisions (as set forth in our Proxy Statement), Qualcomm was above the median based on the measures reflected in the table above, except for revenues. Qualcomm did not “stack the deck” with larger companies as asserted by ISS. |
| • | Applying the ISS CEO pay-for-performance test using Qualcomm’s 27 peer companies, we believe we would pass with “Low Concern” on all three quantitative tests (Relative Degree of Alignment would equal -9%, Multiple of Median would equal 1.32x, and Pay – TSR Alignment would equal 1%). |
| • | When determining compensation for our Named Executive Officers (NEOs), Qualcomm does not benchmark at the 75th percentile as suggested by ISS. We consider competitive compensation practices by other companies as reference points (i.e., the statistical median and the 75th percentile) that the Compensation Committee may use for comparative purposes. We do not target specific benchmark percentiles. |
| • | ISS’ shareholder value transfer (SVT) analytics for evaluating stock plan authorization (where stock plan values are measured as a percent of market capitalization) support the importance of market capitalization. |
We would also like to reiterate, from our fiscal 2011 earnings release and Proxy Statement, our strong performance in fiscal 2011 and our extensive use of performance-based compensation and executive compensation best practice policies.
We delivered record revenues and earnings.
| • | Our fiscal 2011 results included year-over-year increases in revenues (36%), net income (31%), diluted earnings per share (29%) and operating cash flow (20%). |
| • | In fiscal 2011, we returned $1.49 billion of capital to stockholders, including $1.35 billion, or $0.81 per share, in cash dividends paid, and $142 million to repurchase 2.9 million shares of our common stock. |
We make extensive use of performance-based compensation.
| • | In fiscal 2011, a majority of the long-term incentive awards granted to our CEO, the other NEOs and other executive officers were in the form of performance-based awards. The mix of PSUs and RSUs rewards relative and absolute stock price appreciation, thereby aligning the interests of our stockholders and executive officers. |
| • | On average, 77% of our NEOs’ fiscal 2011 annual target compensation was attributable to the grant date fair value of long-term incentive equity awards, and 91% of their fiscal 2011 annual target compensation was variable in the form of annual cash incentives and long-term incentive equity awards. |
3
We have implemented a comprehensive program of compensation best practices.
| • | We employ our NEOs “at will,” without severance agreements or employment contracts. Thus, our CEO and other NEOs do not have guaranteed arrangements for cash compensation or severance upon a change-in-control or excise tax gross-up for change-in-control payments. |
| • | We have stock ownership guidelines covering all NEOs, and increased the ownership guideline for the CEO from five times to six times annual base salary. |
| • | We do not make tax gross-up payments on compensation or benefits, except where directly business-related and provided in a policy applicable to all eligible employees, such as relocation. |
| • | We adopted a cash incentive compensation repayment (“claw back”) policy effective January 1, 2009, and we intend to amend the policy to comply with the additional requirements of the Dodd-Frank Wall Street Reform and Consumer Protection Act of 2010 (Dodd-Frank Act) after the SEC adopts new regulations implementing those requirements. |
| • | Our insider trading policy for executive officers and non-employee directors prohibits transactions involving “short-swing” profits, short sales and derivatives, including put and call options and forward sales contracts. |
The tables at the end of this letter provide additional detail to support our conclusions.
We invite you to read the Proxy Statement for more information regarding the reasons the Board is recommending a vote “FOR” Proposal 3, Advisory Vote on Executive Compensation.
We appreciate your time and consideration on these matters and ask for your support of the Board’s recommendation.
4
Qualcomm scores “Low Concern” under ISS’ CEO pay-for-performance tests when evaluated against its FY11 compensation peer group, which were the companies the Compensation Committee referenced when making FY11 pay decisions.
5
Estimated Results of ISS’ CEO Pay-for-Performance Tests for Qualcomm’s FY11 Peer Group (1) 1-Year Relative Alignment (40% Weight) 3-Year Relative Alignment (60% Weight) Peer Company TSR (2) Peer Company CEO Pay (3) Peer Company TSR (2) Peer Company CEO Pay (3) Amazon.com 38% Apple $377,997 Apple 235% Apple $125,999 Relative Alignment Results Apple 34% Oracle $92,533 Amazon.com 197% Oracle $85,291 IBM 33% Viacom $50,792 TW Cable 104% Viacom $62,375 Weighted RDA eBay 21% DIRECTV $40,410 Broadcom 82% Comcast $31,870 Performance (TSR) 53% Verizon 19% Comcast $37,179 EMC 76% Walt Disney $30,597 minus Pay 61% TW Cable 19% Walt Disney $36,493 DIRECTV 61% IBM $26,999 Relative Degree of -9% Comcast 18% IBM $31,719 Viacom 60% AT&T $24,774 Alignment (RDA) Intel 15% AT&T $29,034 IBM 58% Time Warner $23,107 QCOM 9% Time Warner $25,144 Verizon 46% United Tech $23,087 Key: Viacom 9% United Tech $24,889 Oracle 44% Yahoo! $22,663 Low Concern > -30% Dell 9% TW Cable $23,050 eBay 32% QCOM (2009-11) $20,933 Medium Concern -30% to -50% Oracle 8% QCOM (2011) $21,722 Texas Inst. 32% HP $18,737 High Concern < -50% AT&T 6% HP $18,650 Google 29% TW Cable $18,729 Microsoft 4% Verizon $18,166 United Tech 27% Verizon $18,678 EMC 3% Intel $16,428 Intel 26% DIRECTV $17,708 DIRECTV 2% eBay $14,727 AT&T 23% eBay $17,560 United Tech 1% Adobe Systems $14,590 QCOM 19% Cisco $14,859 Time Warner 0% Texas Inst. $14,392 Time Warner 18% Intel $14,754 Texas Inst. 0% Yahoo! $13,936 Comcast 13% Adobe Systems $13,090 CEO Pay Multiple Results Google -2% EMC $13,151 Walt Disney 2% Texas Inst. $11,904 Broadcom -5% Cisco $12,886 Microsoft 0% Corning $10,924 1-Year CEO Pay Multiple Yahoo! -7% Broadcom $12,323 Dell -14% Broadcom $10,820 Peer Group Median $16,428 Adobe Systems -8% Corning $11,662 Corning -18% EMC $10,478 Qualcomm (2011) 1.32x Walt Disney -8% Applied Mats. $9,555 Yahoo! -24% Applied Mats. $7,637 Applied Mats. -9% Dell $4,348 Applied Mats. -27% Dell $2,474 Key: Cisco -29% Amazon.com $1,682 Cisco -31% Amazon.com $1,582 Low Concern < 2.33x Corning -32% Microsoft $1,377 Adobe Systems -39% Microsoft $1,335 Medium Concern 2.33x to 3.33x HP -46% Google $313 HP -50% Google $356 High Concern > 3.33x QCOM % Rank 70% QCOM % Rank 59% QCOM % Rank 41% QCOM % Rank 63% 1-Year RDA 11% 3-Year RDA -22% (1) Compensation data are provided by Equilar, with stock options valued under ISS’ methodology, which differs from the ASC 718 grant date fair valued reported in the proxy. Motorola is excluded from the analysis, as it was subsequently split into two public companies. (2) TSR data are from the Standard & Poor’s Research Insight database. One-year TSR reflects the period from 9/30/10 to 9/30/11, and three-year TSR reflects the period from 9/30/08 to 9/30/11. (3) CEO compensation shown in thousands. One year reflects fiscal 2011 and three year reflects the mean of fiscal 2009, 2010, and 2011.
Qualcomm is above the median of its FY11 compensation peers when measured by market capitalization, net income, and net income margin, while its FY11 revenues were below the median of the peer group.

6
QCOM Size versus FY11 Compensation Peer Group Market Capitalization Value Trailing 4Q Trailing 4Q Trailing 4Q as of 9/30/11 ($ millions) Net Income ($ millions) Net Income Margin (%) Revenue ($ millions) Apple $353,518 Apple $32,982 Corning 35.6% Apple $127,841 IBM $208,843 Microsoft $23,468 Microsoft 32.6% Hewlett-Packard $127,245 Microsoft $208,535 IBM $15,855 Qualcomm 29.3% AT&T $126,723 AT&T $169,010 Intel $12,942 eBay 27.7% Verizon $110,875 Oracle $144,982 Google $9,737 Apple 25.8% IBM $106,916 Google $130,933 Oracle $9,356 Google 25.7% Microsoft $72,052 Intel $112,030 Hewlett-Packard $7,074 Oracle 25.5% Dell $61,732 Verizon $104,181 Cisco Systems $6,337 Intel 24.0% United Technologies $58,190 Amazon.com $98,154 United Technologies $4,979 Yahoo! 21.0% Intel $53,999 Cisco Systems $83,434 Disney (Walt) $4,807 Adobe Systems 19.8% Comcast $50,521 Qualcomm $81,553 Qualcomm $4,260 Applied Materials 18.3% Cisco Systems $43,724 United Technologies $63,937 AT&T $3,944 Texas Instruments 16.3% Amazon.com $43,593 Comcast $57,184 Comcast $3,891 IBM 14.8% Disney (Walt) $40,893 Disney (Walt) $55,977 Dell $3,655 Cisco Systems 14.5% Google $37,905 Hewlett-Packard $44,607 eBay $3,229 Viacom 14.3% Oracle $36,704 EMC $43,343 Time Warner $2,882 Broadcom 12.5% Time Warner $28,593 eBay $38,006 Corning $2,805 EMC 12.3% DirecTV $26,384 Time Warner $31,312 DirecTV $2,509 Disney (Walt) 11.8% EMC $20,008 DirecTV $31,207 EMC $2,461 Time Warner 10.1% Time Warner Cable $19,675 Texas Instruments $30,789 Verizon $2,404 DirecTV 9.5% Viacom $14,914 Dell $25,797 Texas Instruments $2,236 United Technologies 8.6% Qualcomm $14,556 Viacom $22,754 Viacom $2,136 Time Warner Cable 8.5% Texas Instruments $13,735 Time Warner Cable $20,379 Applied Materials $1,926 Comcast 7.7% eBay $11,652 Corning $19,419 Time Warner Cable $1,665 Dell 5.9% Applied Materials $10,517 Yahoo! $16,629 Yahoo! $1,049 Hewlett-Packard 5.6% Corning $7,890 Broadcom $16,012 Broadcom $939 AT&T 3.1% Broadcom $7,515 Applied Materials $13,643 Amazon.com $870 Verizon 2.2% Yahoo! $4,984 Adobe Systems $11,937 Adobe Systems $833 Amazon.com 2.0% Adobe Systems $4,216 75th Percentile $106,143 $6,521 24.3% $59,076 Median $50,292 $3,442 14.4% $37,305 25th Percentile $25,036 $2,211 8.5% $14,351 Qualcomm Rank 11 of 28 11 of 28 3 of 28 21 of 28 Notes: All data are sourced from Standard & Poor’s Research Insight database (effective 1/31/12),which may differ from the financial information as filed with the Securities and Exchange Commission. Quartile statistics include Qualcomm. Motorola is excluded from the FY11 peer group, because it subsequently split into two public companies.
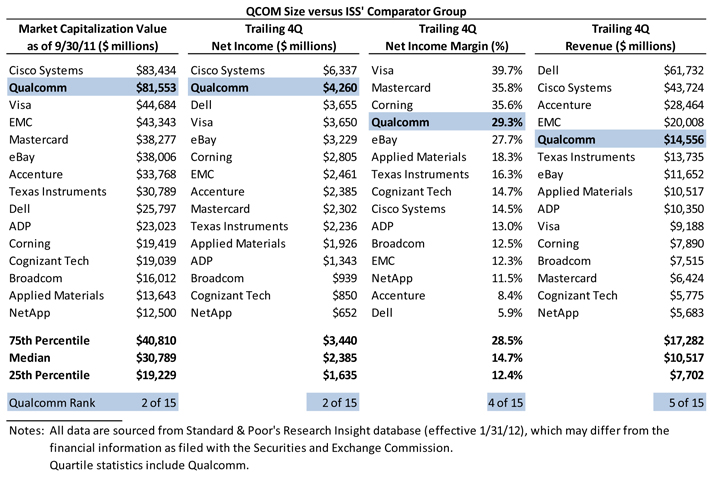
Qualcomm is significantly larger than the comparator companies used by ISS in their evaluation of our CEO’s FY11 compensation.
7
QCOM Size versus ISS’ Comparator Group Market Capitalization Value Trailing 4Q Trailing 4Q Trailing 4Q as of 9/30/11 ($ millions) Net Income ($ millions) Net Income Margin (%) Revenue ($ millions) Cisco Systems $83,434 Cisco Systems $6,337 Visa 39.7% Dell $61,732 Qualcomm $81,553 Qualcomm $4,260 Mastercard 35.8% Cisco Systems $43,724 Visa $44,684 Dell $3,655 Corning 35.6% Accenture $28,464 EMC $43,343 Visa $3,650 Qualcomm 29.3% EMC $20,008 Mastercard $38,277 eBay $3,229 eBay 27.7% Qualcomm $14,556 eBay $38,006 Corning $2,805 Applied Materials 18.3% Texas Instruments $13,735 Accenture $33,768 EMC $2,461 Texas Instruments 16.3% eBay $11,652 Texas Instruments $30,789 Accenture $2,385 Cognizant Tech 14.7% Applied Materials $10,517 Dell $25,797 Mastercard $2,302 Cisco Systems 14.5% ADP $10,350 ADP $23,023 Texas Instruments $2,236 ADP 13.0% Visa $9,188 Corning $19,419 Applied Materials $1,926 Broadcom 12.5% Corning $7,890 Cognizant Tech $19,039 ADP $1,343 EMC 12.3% Broadcom $7,515 Broadcom $16,012 Broadcom $939 NetApp 11.5% Mastercard $6,424 Applied Materials $13,643 Cognizant Tech $850 Accenture 8.4% Cognizant Tech $5,775 NetApp $12,500 NetApp $652 Dell 5.9% NetApp $5,683 75th Percentile $40,810 $3,440 28.5% $17,282 Median $30,789 $2,385 14.7% $10,517 25th Percentile $19,229 $1,635 12.4% $7,702 Qualcomm Rank 2 of 15 2 of 15 4 of 15 5 of 15 Notes: All data are sourced from Standard & Poor’s Research Insight database (effective 1/31/12), which may differ from the financial information as filed with the Securities and Exchange Commission. Quartile statistics include Qualcomm.